
Overview
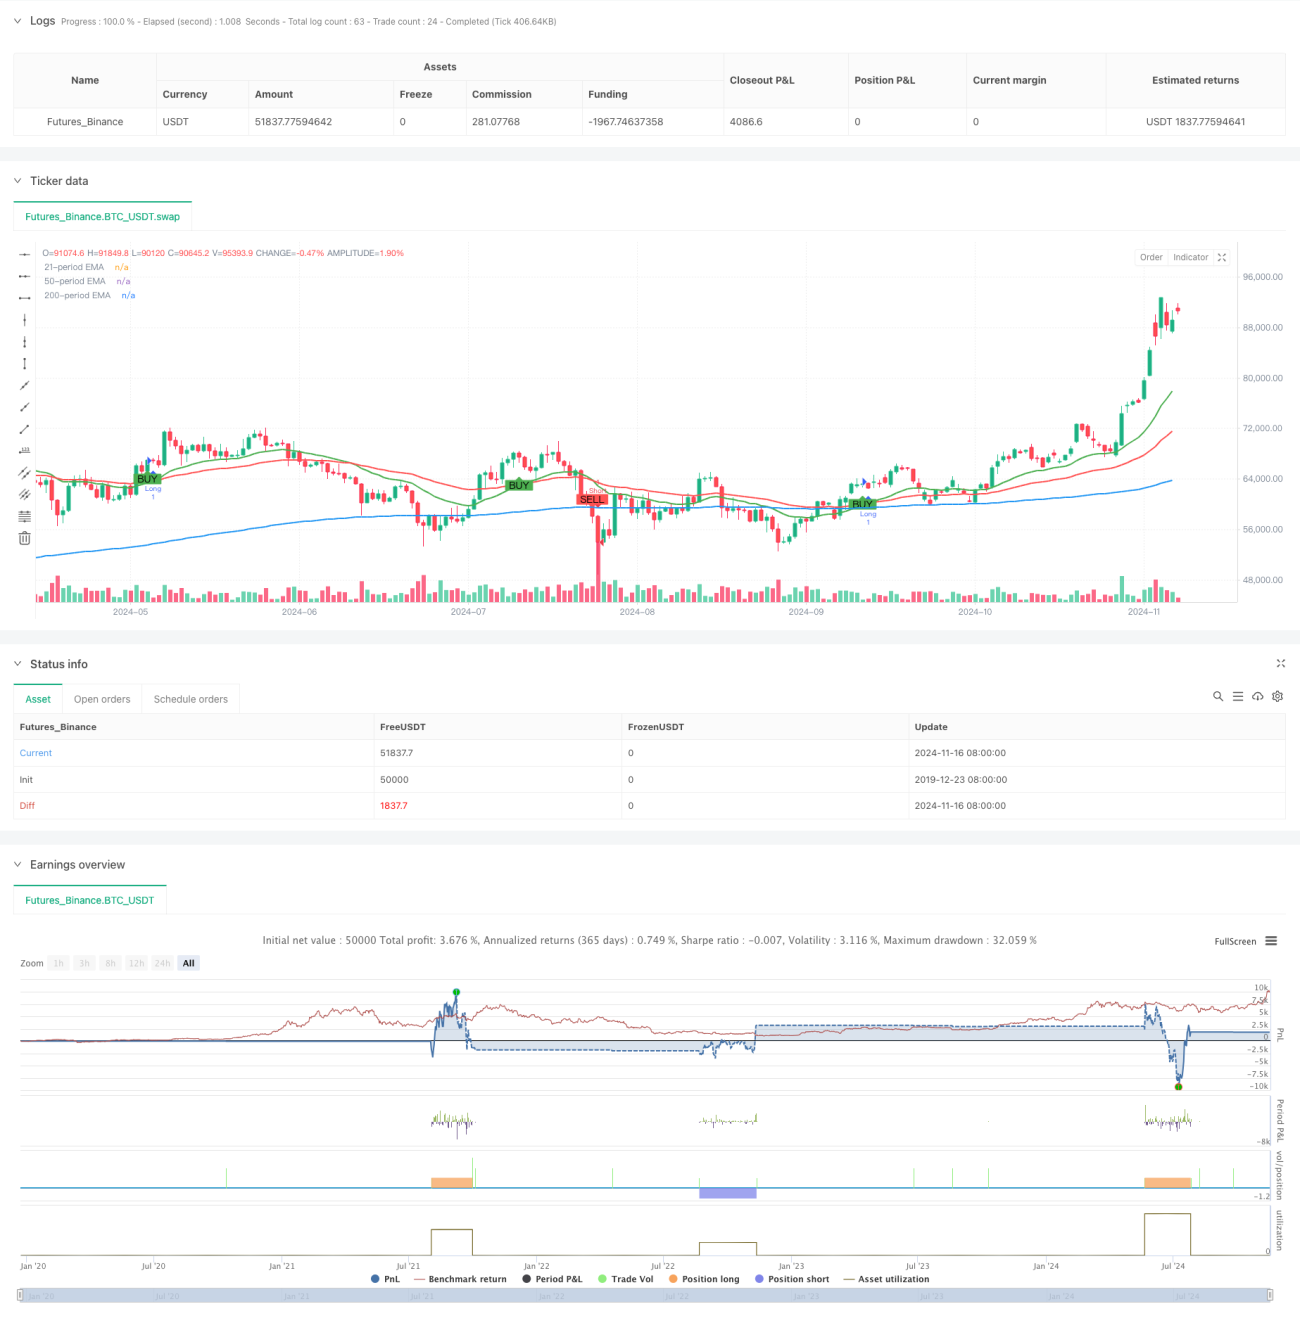
This strategy is a trend following system based on multiple Exponential Moving Average (EMA) crossovers, combined with dynamic stop-loss and take-profit mechanisms. The strategy employs three EMAs - 21-period, 50-period, and 200-period - generating trading signals through short-term and medium-term EMA crossovers while using the long-term EMA to confirm overall trend direction. It includes flexible stop-loss and take-profit levels for risk management. The strategy is particularly suitable for markets with significant volatility and medium to long-term trend trading.
Strategy Principles
The core logic is based on the synergistic effect of a triple EMA system:
- Uses 21-period EMA as the fast moving average to reflect short-term price movements
- Employs 50-period EMA as the medium-term moving average for signal generation
- Utilizes 200-period EMA as the long-term moving average for trend confirmation
- Generates long signals when the 21-period EMA crosses above the 50-period EMA and price is above the 200-period EMA
- Generates short signals when the 21-period EMA crosses below the 50-period EMA and price is below the 200-period EMA
- Each trading signal is equipped with corresponding stop-loss and take-profit levels calculated based on current price and user-defined ticks
Strategy Advantages
- Multiple timeframe validation: Effectively reduces false breakout risks through triple EMA coordination
- Trend confirmation mechanism: Uses 200-period EMA as a trend filter to improve directional accuracy
- Comprehensive risk management: Built-in dynamic stop-loss and take-profit mechanism for precise risk control
- Flexible parameters: Adjustable stop-loss and take-profit levels for different market characteristics
- Strong visualization: Clear graphical interface showing all trading signals and risk control levels
- Simple logic: Easy to understand and maintain, suitable for both novice and professional traders
Strategy Risks
- Choppy market risk: May generate frequent false signals in ranging markets
- Slippage impact: Actual execution prices may differ significantly from signal prices during volatile periods
- Fixed stop-loss risk: Preset tick values may not suit all market conditions
- Trend reversal risk: Potential for significant drawdowns at trend turning points
- Parameter optimization risk: Over-optimization may lead to poor real-world performance
Optimization Directions
- Incorporate volatility indicators: Dynamically adjust stop-loss and take-profit levels based on ATR
- Add volume confirmation: Use trading volume as a supplementary signal confirmation
- Optimize entry timing: Consider waiting for pullbacks after EMA crossovers
- Add trend strength filtering: Incorporate ADX or similar indicators to evaluate trend strength
- Improve stop-loss mechanism: Implement trailing stops or support/resistance-based intelligent stops
- Develop adaptive parameters: Dynamically adjust EMA periods based on market conditions
Summary
This strategy effectively captures market trends through the coordination of multiple EMA systems. Its comprehensive risk management mechanism and clear trading logic make it a practical trading tool. Through continuous optimization and improvement, the strategy can better adapt to different market environments, enhancing trading efficiency and stability. Traders are advised to conduct thorough backtesting and parameter optimization before live implementation, making appropriate adjustments based on market characteristics and individual risk preferences.
- 1