ATR Volatility and Moving Average Based Adaptive Trend Following Exit Strategy

Overview
This is a trend following strategy based on ATR (Average True Range) bands and moving averages. The strategy utilizes the ATR indicator to dynamically adjust profit-taking and stop-loss positions, while using moving averages to determine market trend direction, achieving trend capture and risk control. The core of the strategy lies in using ATR bands as a dynamic exit mechanism, allowing the strategy to adaptively adjust position exit points based on market volatility changes.
Strategy Principles
The strategy consists of three core components:
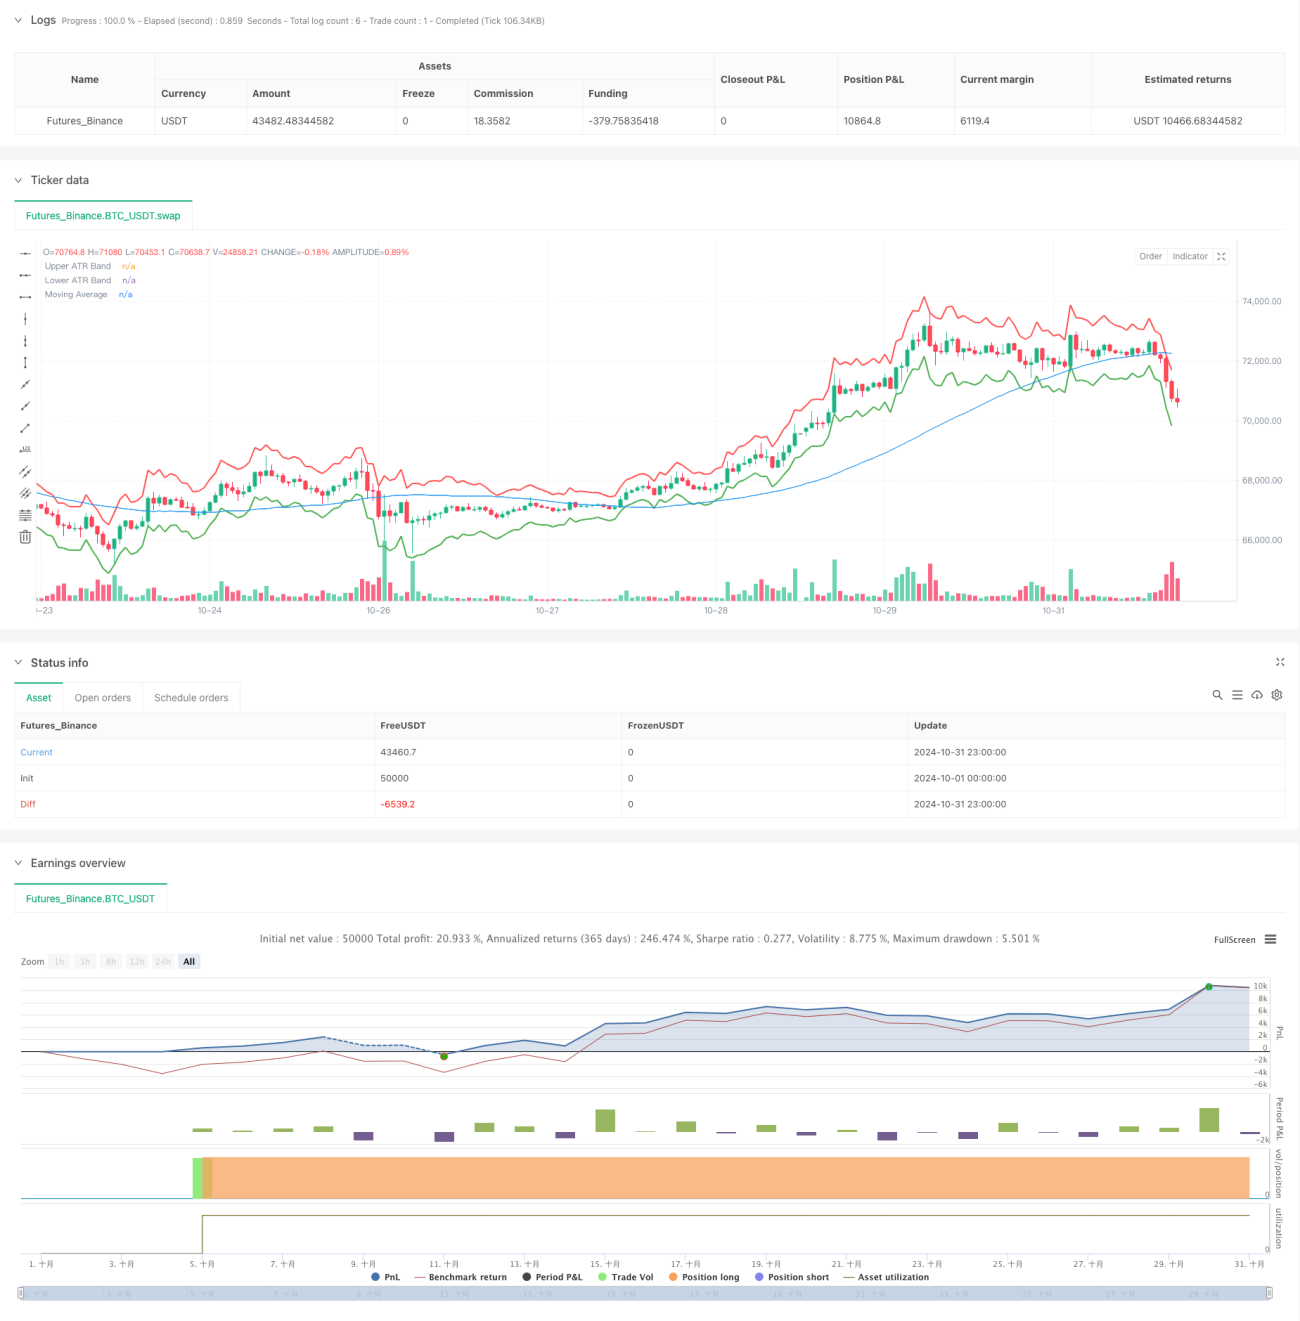
- ATR Band Calculation: Uses 14-period ATR indicator, constructing upper and lower volatility bands by adding and subtracting 2 times the ATR value from the current closing price.
- Moving Average System: Employs a 50-period Simple Moving Average (SMA) as the basis for trend judgment.
- Trade Signal Generation:
- Entry Signal: Initiates a long position when price crosses above the moving average.
- Exit Signal: Closes positions when price touches either the upper or lower ATR band.
The strategy combines trend following with volatility management, enabling both market trend capture and dynamic risk exposure adjustment based on market volatility changes.
Strategy Advantages
- Strong Adaptability: ATR indicator automatically adjusts profit-taking and stop-loss positions based on market volatility changes, providing good market adaptability.
- Reasonable Risk Control: Effectively controls risk exposure for each trade through ATR multiplier settings.
- Robust Trend Capture: Effectively identifies market trend direction by incorporating moving averages.
- Flexible Parameter Settings: Can adapt to different market environments by adjusting ATR period, multiplier, and moving average period.
- Clear Execution Logic: Precise entry and exit conditions avoid interference from subjective judgment.
Strategy Risks
- Choppy Market Risk: May generate frequent false signals in sideways markets, leading to excessive trading costs.
- Slippage Risk: Actual execution prices may significantly deviate from theoretical prices during intense market volatility.
- Trend Reversal Risk: May not stop losses timely when market trends suddenly reverse.
- Parameter Optimization Risk: Optimal parameters may vary significantly across different market environments.
Strategy Optimization Directions
-
Incorporate Trend Strength Filtering:
- Add trend strength indicators like ADX or DMI to filter trading signals in weak trend environments.
- Adjust ATR multiplier in strong trend environments to capture larger profit potential.
-
Enhance Position Management:
- Dynamically adjust position size based on ATR values.
- Implement staged position building and reduction mechanisms.
-
Add Market Environment Recognition:
- Introduce volatility cycle analysis.
- Add market pattern recognition module.
-
Optimize Exit Mechanism:
- Implement dynamic profit protection.
- Add time-based stop-loss mechanism.
Summary
This strategy constructs an adaptive and risk-controlled trend following system by combining ATR bands and moving averages. The core advantage lies in its ability to dynamically adjust risk control positions based on market volatility changes while capturing market trend direction through moving averages. Although inherent risks exist, the proposed optimization directions can further enhance strategy stability and profitability. This is a practically valuable strategy framework suitable for in-depth research and application in live trading.
- 1