
Overview
This is a trend-following strategy based on Bollinger Bands and candlestick pattern analysis. The strategy primarily identifies potential market reversal points by observing candlestick patterns when price touches Bollinger Bands, combined with the ratio relationship between wicks and body. Additionally, the strategy employs a fixed risk model to control exposure per trade and utilizes multiple timeframe analysis to enhance trading accuracy.
Strategy Principles
The core logic of the strategy is based on several key elements: First, it calculates Bollinger Bands over 20 periods to determine price volatility range; Second, when price touches the Bollinger Bands, it analyzes the ratio between upper/lower wicks and body of the candlestick, considering it as a potential reversal signal when the ratio exceeds the set threshold; Third, it calculates key support and resistance levels for stop-loss placement; Finally, it calculates position size for each trade based on a fixed percentage (1%) of the account balance, implementing dynamic risk management. The strategy also offers various entry timing options, including closing price, opening price, daily high, and daily low.
Strategy Advantages
- Precise risk control: Uses fixed percentage risk management model, ensuring controlled risk exposure per trade
- Flexible entry points: Provides multiple entry price options to accommodate different trading styles
- Technical indicator combination: Combines Bollinger Bands with candlestick pattern analysis for improved signal reliability
- Rational stop-loss placement: Sets stop-losses based on key support and resistance levels, aligning with market dynamics
- Comprehensive trade management: Includes order expiration mechanism to avoid false signals
Strategy Risks
- Rapid market fluctuation risk: Wick ratios may generate false signals in volatile markets
- Money management risk: Fixed percentage risk model might lead to undersized positions after consecutive losses
- Stop-loss placement risk: Support and resistance calculations may not be accurate under certain market conditions
- Timeframe dependency: Strategy primarily based on daily timeframe may miss opportunities in smaller timeframes
Strategy Optimization Directions
- Incorporate volume indicators: Add volume analysis for signal confirmation to improve reliability
- Optimize stop-loss mechanism: Consider implementing dynamic stop-loss that adjusts based on market volatility
- Add market environment filters: Include trend strength indicators to adjust strategy parameters in different market conditions
- Improve position management: Consider implementing dynamic position sizing based on market volatility
- Add time filters: Include time filters to avoid trading during highly volatile market sessions
Summary
This strategy combines classical technical analysis tools with modern risk management methods to build a relatively comprehensive trading system. The core advantages lie in its strict risk control and flexible entry mechanisms, while attention needs to be paid to market environment changes and signal reliability verification in practical applications. Through the suggested optimization directions, there is room for further improvement, particularly in signal filtering and risk management aspects.
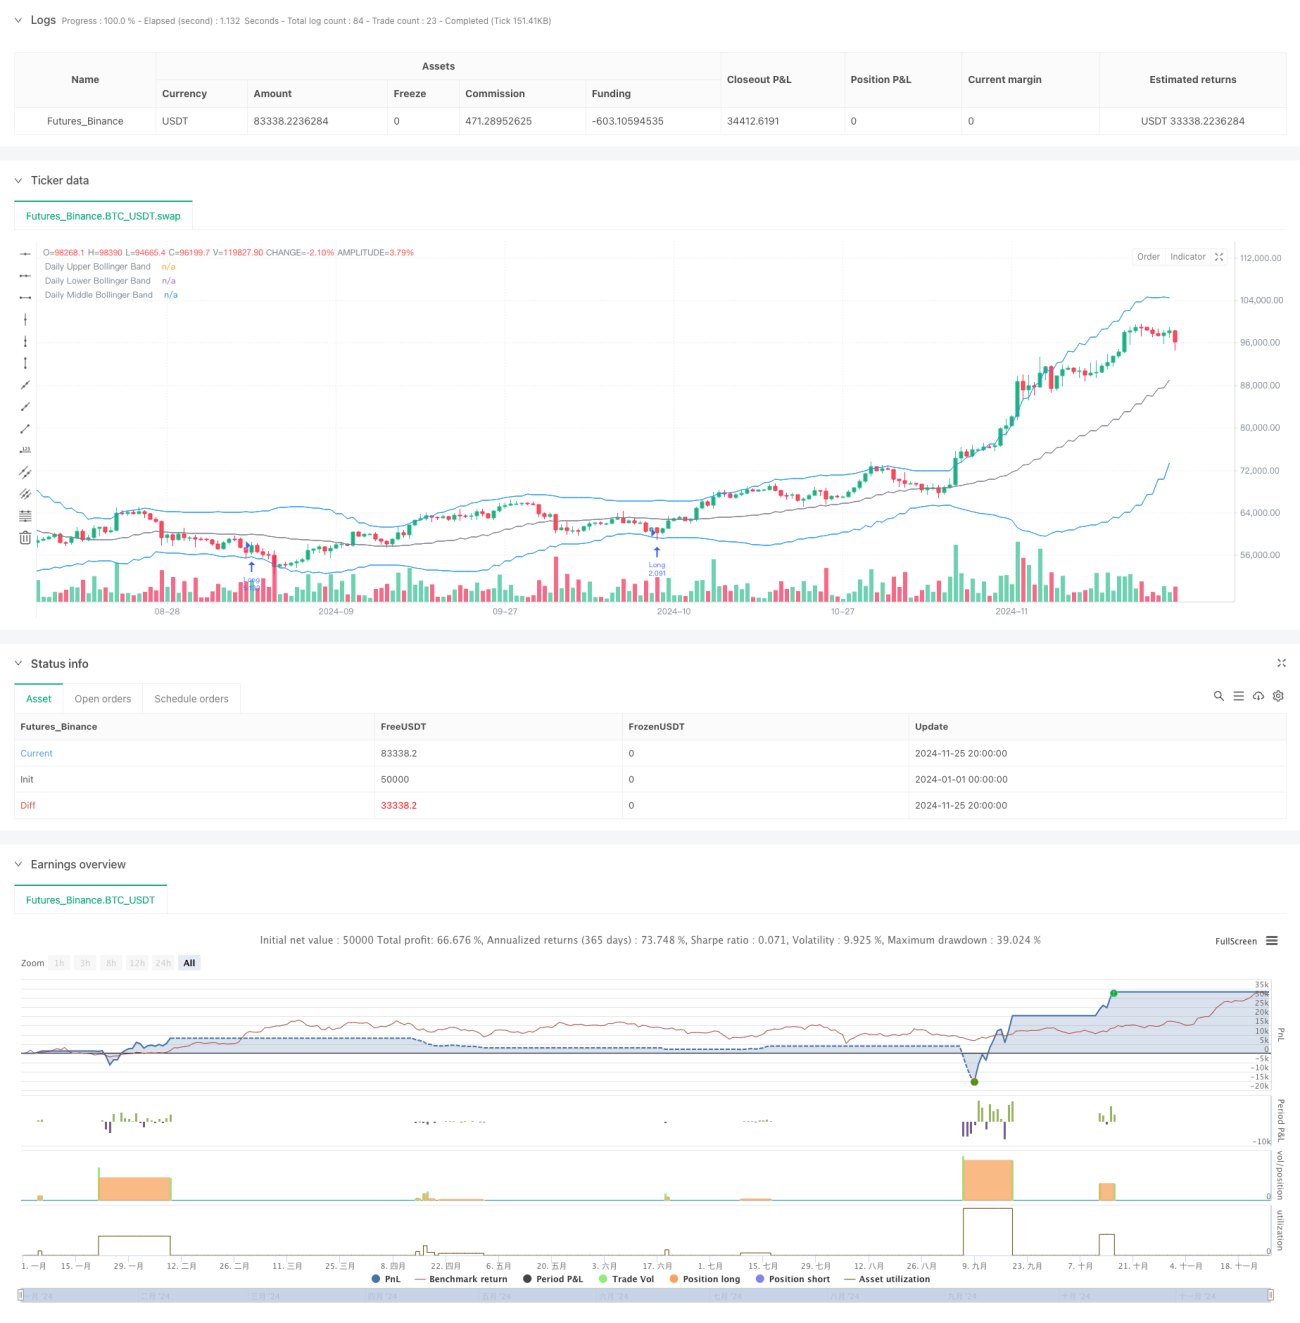
/*backtest
start: 2024-01-01 00:00:00
end: 2024-11-26 00:00:00
period: 12h
basePeriod: 12h
exchanges: [{"eid":"Futures_Binance","currency":"BTC_USDT"}]
*/

//@version=5
strategy("Trade Entry Detector, based on Wick to Body Ratio when price tests Bollinger Bands", overlay=true, default_qty_type=strategy.fixed)

// Input for primary analysis time frame- 1