Dynamic Trading Strategy System Based on Parabolic SAR Indicator

Overview
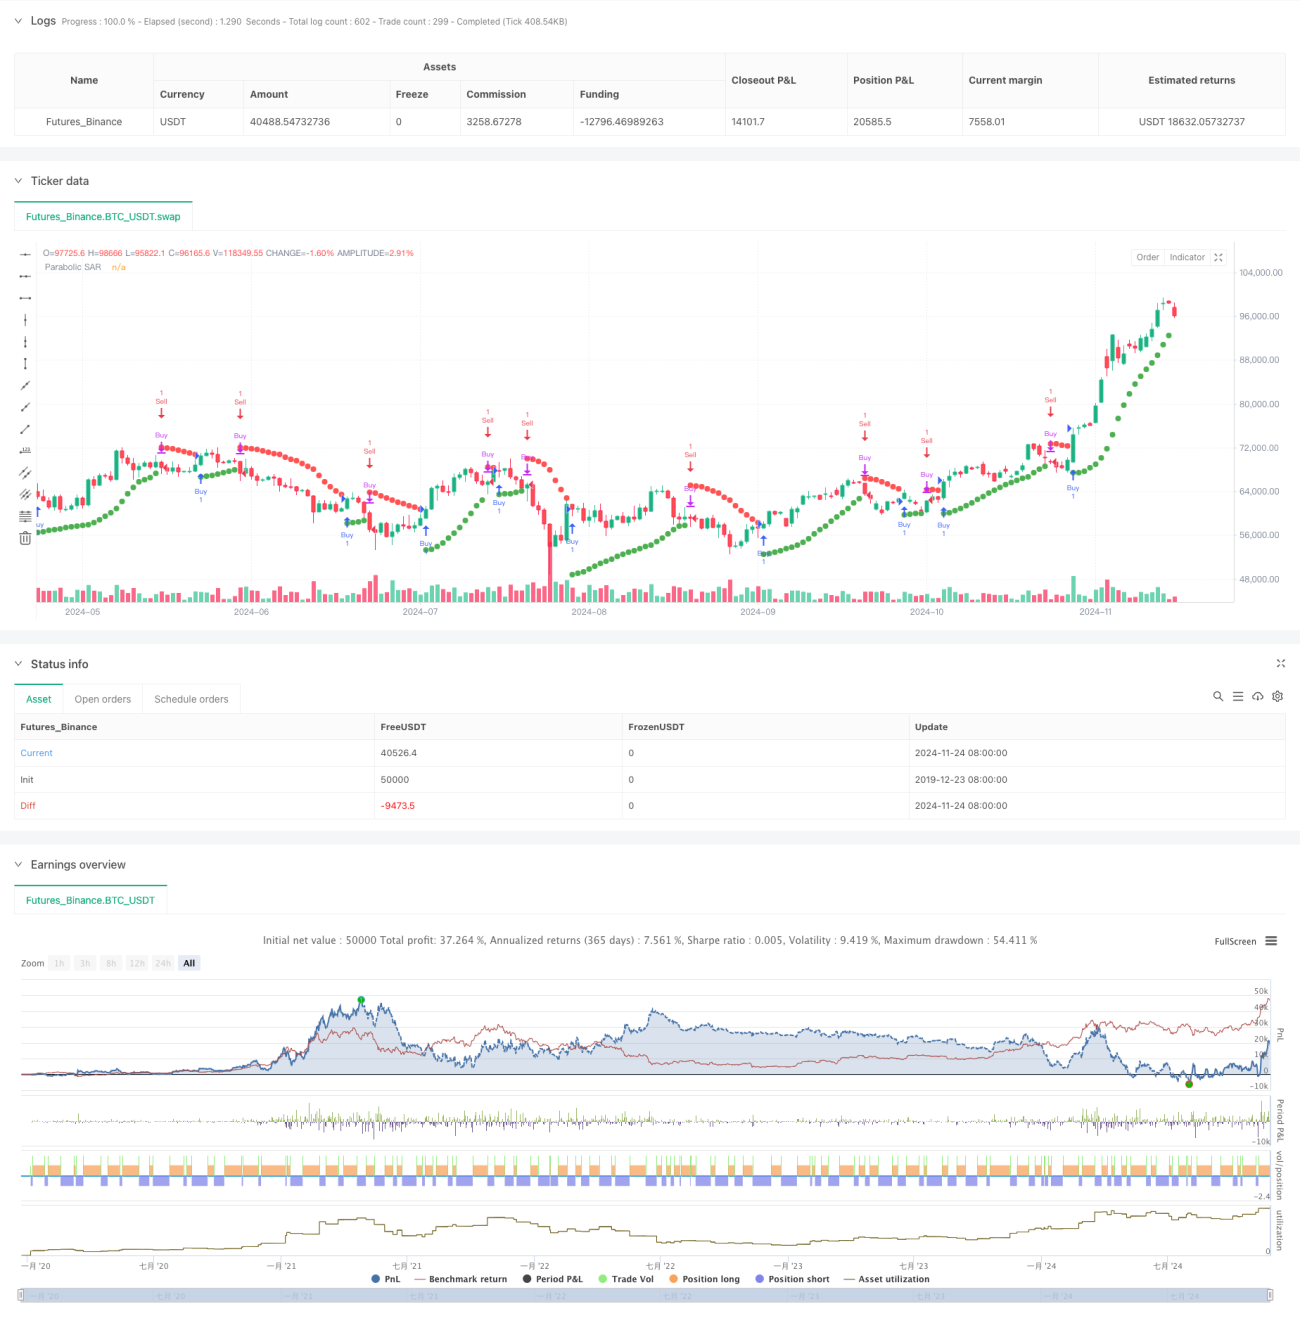
This strategy is a comprehensive trading system based on the Parabolic SAR (Stop and Reverse) indicator, making buy and sell decisions through dynamic price trend tracking. The system adopts a classical trend-following method, combining both long and short trading mechanisms to capture price movements in different market conditions. The core of the strategy lies in using SAR indicator crossovers with price to identify trend reversal points and execute position operations at appropriate times.
Strategy Principles
The strategy operates based on the following core principles:
- Uses the Parabolic SAR indicator as the primary trend determination tool, which dynamically adjusts its position according to price movements.
- When the SAR indicator crosses under the price, the system identifies the beginning of an upward trend and triggers a long signal.
- When the SAR indicator crosses over the price, the system identifies the beginning of a downward trend and triggers a short signal.
- The strategy controls the SAR indicator's sensitivity through three key parameters: starting value (0.02), step increment (0.02), and maximum value (0.2).
- The system automatically plots SAR points on the chart, displayed in green during uptrends and red during downtrends.
Strategy Advantages
- Systematic Trend Following: The strategy is fully systematic, avoiding emotional interference from subjective judgments.
- Dynamic Stop-Loss Mechanism: The SAR indicator automatically adjusts with price movements, providing dynamic stop-loss levels.
- Bi-directional Trading: Supports both long and short positions, enabling profit potential in various market conditions.
- Visual Support: Through color-differentiated SAR points display, traders can intuitively understand market conditions.
- Adjustable Parameters: Can adapt to different market volatility characteristics through adjustment of three core parameters.
Strategy Risks
- Choppy Market Risk: May generate frequent false signals in sideways markets, leading to consecutive stops.
- Slippage Risk: In fast markets, actual execution prices may significantly deviate from signal generation prices.
- Parameter Sensitivity: Different parameter settings significantly affect strategy performance, requiring careful optimization.
- Trend Reversal Risk: May experience significant drawdowns during sudden trend reversals.
Strategy Optimization Directions
- Introduce Trend Filters: Can add additional trend determination indicators, such as moving averages, to reduce false signals.
- Optimize Parameter Adjustment Mechanism: Can dynamically adjust SAR parameters based on market volatility.
- Enhance Risk Control Module: Add fixed stop-losses and profit targets to improve risk management capabilities.
- Incorporate Volume Analysis: Combine volume indicators to improve signal reliability.
- Develop Market Environment Recognition: Add market state identification functionality to use different parameter settings under different market conditions.
Summary
This is a complete trading strategy based on classic technical indicators, characterized by systematic and objective features. Through appropriate parameter settings and strategy optimization, this system can achieve good performance in trending markets. However, users need to fully recognize the strategy's limitations, especially its potentially suboptimal performance in choppy markets. It is recommended to conduct thorough backtesting and parameter optimization before live implementation, combined with appropriate risk management measures.
- 1