Adaptive Bollinger Breakout with Moving Average Quantitative Strategy System

Overview
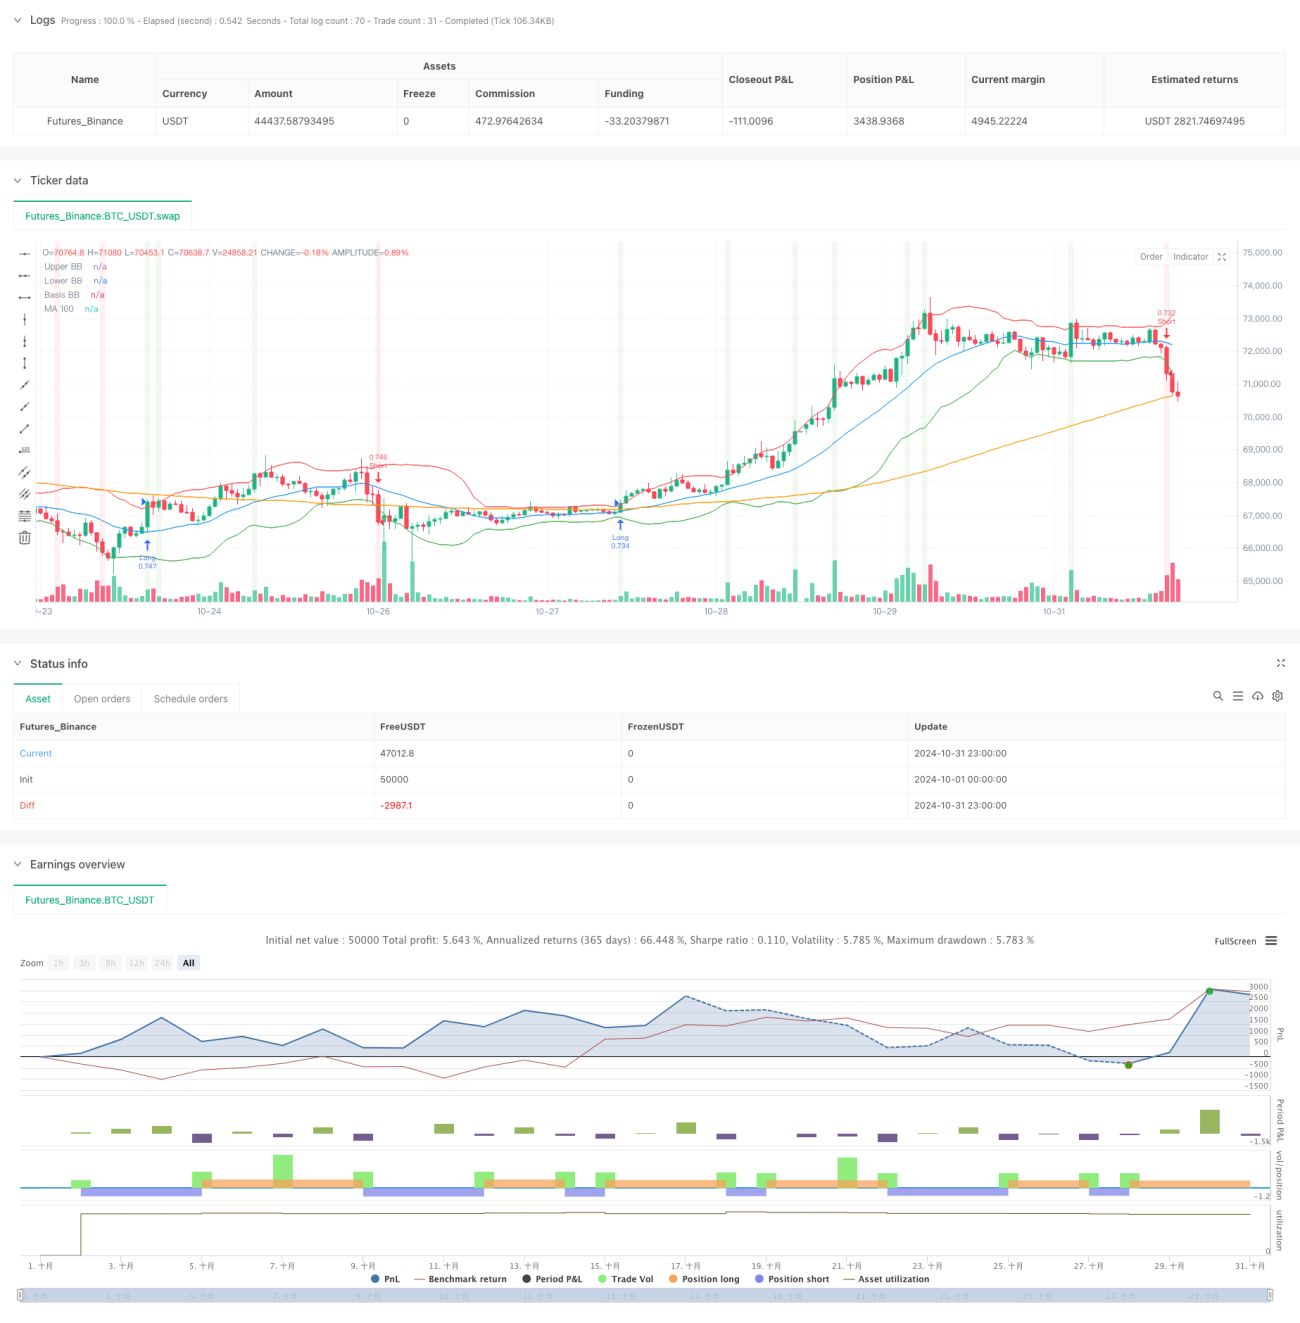
This strategy is a quantitative trading system that combines Bollinger Bands breakout with moving average trends. The system automatically captures market opportunities by monitoring price relationships with Bollinger Bands while using a 100-day moving average for trend confirmation. It implements dynamic position sizing based on account equity for automatic risk management.
Strategy Principles
The core logic is based on the following key elements:
- Uses 20-period Bollinger Bands as volatility channels with 2 standard deviations
- Employs 100-day moving average as medium to long-term trend confirmation
- Generates long signals when price breaks above the upper band and wasn't above in the previous period
- Generates short signals when price breaks below the lower band and wasn't below in the previous period
- Calculates position size dynamically based on current account equity
- Automatically closes positions on contrary signals for timely risk management
Strategy Advantages
- High Adaptability - Bollinger Bands automatically adjust channel width based on market volatility
- Controlled Risk - Dynamic position sizing ensures risk matches account size
- Trend Confirmation - Integration with moving average improves signal reliability
- Timely Stop Loss - Clear exit conditions prevent excessive losses
- Bilateral Trading - Captures both upward and downward trends for improved capital efficiency
- Clean Code - Clear strategy logic for easy maintenance and optimization
Strategy Risks
- False breakouts in ranging markets may lead to consecutive losses
- Fixed Bollinger Bands parameters may not suit all market conditions
- Lack of trailing stops may fail to lock in profits effectively
- Long moving average period may result in delayed signals
- Trading costs not considered, live performance may differ from backtests
Optimization Directions
- Add volatility filters to reduce trading frequency in low volatility environments
- Implement dynamic stop-loss mechanisms based on market volatility
- Optimize Bollinger Bands parameters with adaptive periods
- Add volume and holding time filters
- Include additional technical indicators for signal confirmation
- Set maximum drawdown limits for enhanced risk control
Summary
This strategy builds a complete quantitative trading system by combining Bollinger Bands and moving averages. While maintaining simple logic, it implements core functionalities including signal generation, position management, and risk control. Though there are areas for optimization, the overall design is sound and has practical application value. It's recommended to thoroughly optimize parameters and validate through backtesting before live implementation, with adjustments made according to specific market characteristics.
- 1