
Overview
This is a quantitative trading strategy based on three technical indicators: VWAP, MACD, and RSI. The strategy identifies trading opportunities by combining signals from Volume Weighted Average Price (VWAP), Moving Average Convergence Divergence (MACD), and Relative Strength Index (RSI). It incorporates percentage-based take-profit and stop-loss mechanisms for risk management and uses strategy position sizing to optimize capital utilization.
Strategy Principles
The core logic is based on the comprehensive analysis of three main indicators:
- VWAP serves as the primary trend reference line, with price crossovers indicating potential trend changes
- MACD histogram confirms trend strength and direction, with positive values indicating uptrends and negative values indicating downtrends
- RSI identifies overbought or oversold market conditions to avoid entering at extreme levels
Buy conditions require:
- Price crosses above VWAP
- Positive MACD histogram
- RSI below overbought level
Sell conditions require:
- Price crosses below VWAP
- Negative MACD histogram
- RSI above oversold level
Strategy Advantages
- Multiple technical indicators cross-validation improves signal reliability
- VWAP incorporates volume factor for enhanced market depth analysis
- RSI filters extreme market conditions, reducing false breakout risks
- Percentage-based take-profit and stop-loss adapt to different price ranges
- Position sizing based on account equity enables dynamic position management
- Clear strategy logic, easy to understand and maintain
Strategy Risks
- Choppy markets may generate frequent trades, increasing transaction costs
- Multiple indicators might lead to delayed signals, affecting entry timing
- Fixed percentage take-profit and stop-loss may not suit all market conditions
- Lack of volatility consideration could increase risk during high volatility periods
- Absence of trend strength filtering may generate excessive signals in weak trends
Strategy Optimization Directions
- Introduce ATR for dynamic adjustment of take-profit and stop-loss levels
- Add trend strength filters to reduce false signals in choppy markets
- Optimize VWAP period settings, consider multiple VWAP periods combination
- Implement volume confirmation mechanism to improve breakout signal reliability
- Consider adding time filters to avoid trading during low liquidity periods
- Implement dynamic position sizing mechanism based on market conditions
Summary
This strategy constructs a relatively complete trading system by combining three classic technical indicators: VWAP, MACD, and RSI. The design emphasizes signal reliability and risk management through multiple indicator cross-validation to improve trading quality. While there are aspects that need optimization, the overall framework is sound and offers good scalability. Traders are advised to validate the strategy through backtesting across different market conditions and optimize parameters according to specific requirements before live implementation.
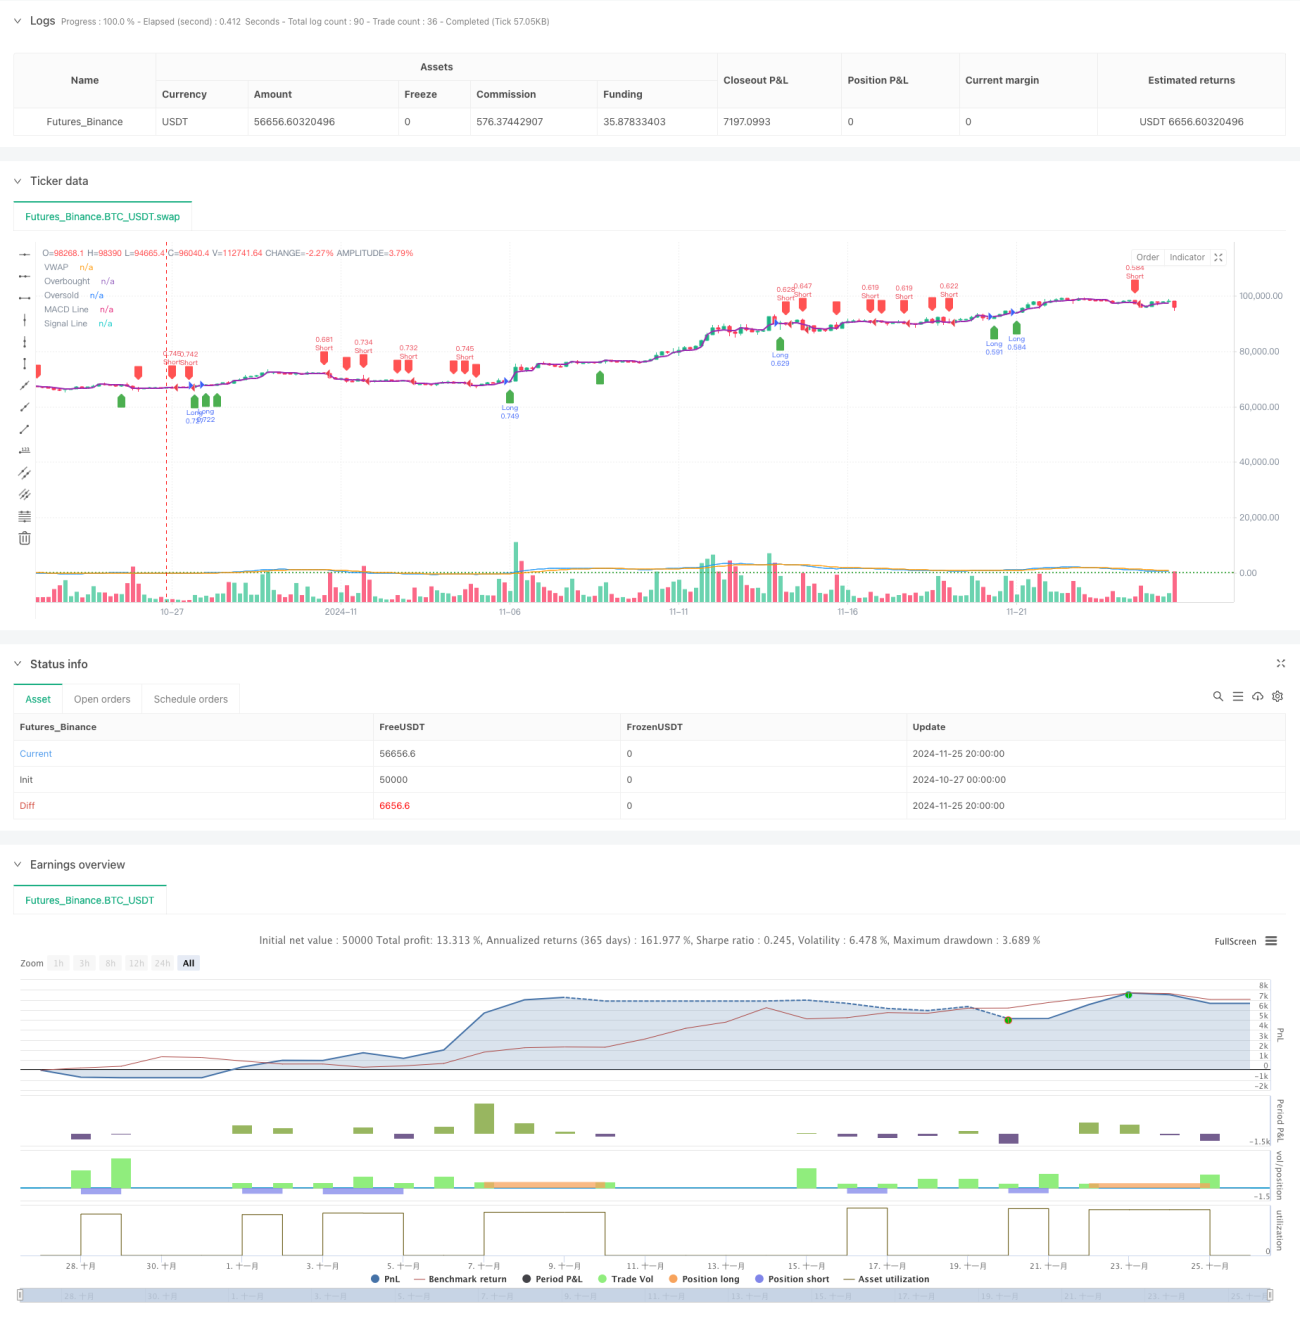
/*backtest
start: 2024-10-27 00:00:00
end: 2024-11-26 00:00:00
period: 4h
basePeriod: 4h
exchanges: [{"eid":"Futures_Binance","currency":"BTC_USDT"}]
*/

//@version=5
strategy("pbs", overlay=true, default_qty_type=strategy.percent_of_equity, default_qty_value=100)

// Input for take-profit and stop-loss- 1