Multi-SMA Support Level False Breakout Strategy with ATR Stop-Loss System

Overview
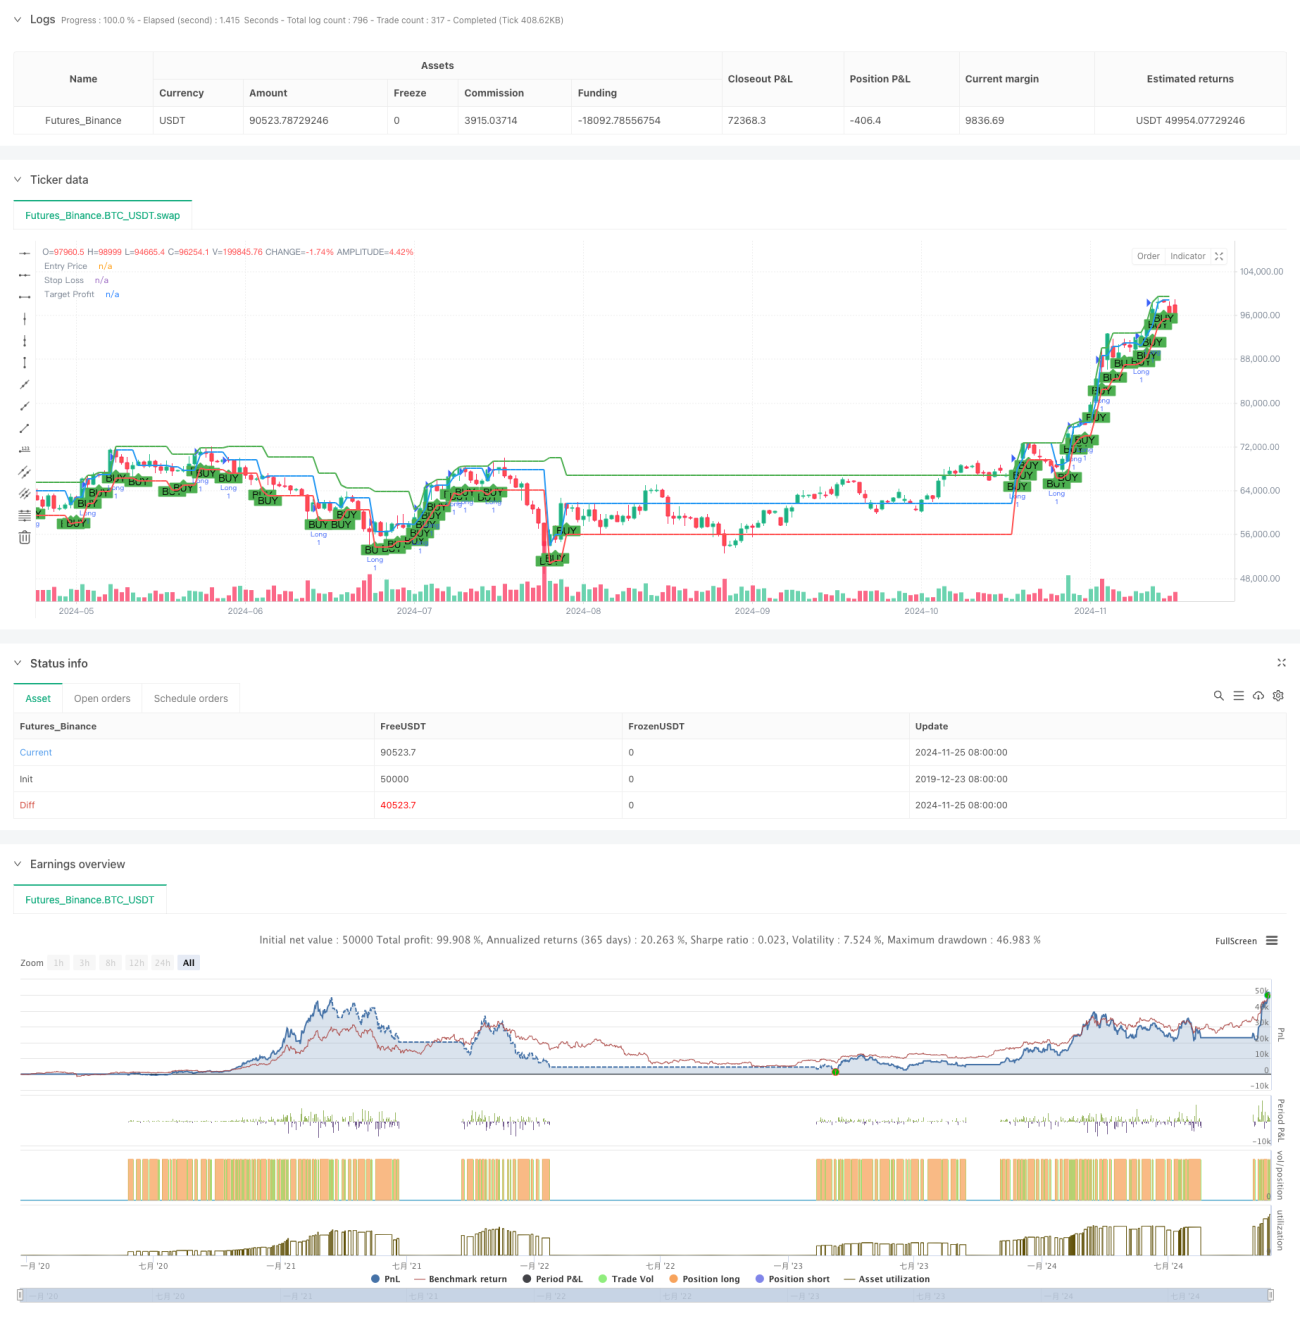
This strategy is a trading system based on moving average trend determination and support level false breakout patterns. The strategy uses 50-period and 200-period simple moving averages to determine market trends, combines support level false breakout patterns to generate trading signals, and uses the ATR (Average True Range) indicator to dynamically set stop-loss positions while setting profit targets at breakout points. This strategy fully utilizes market trend characteristics and price movement patterns to capture opportunities for profit through rebounds after false breakouts.
Strategy Principles
The core logic of the strategy includes the following key elements:
- Trend Determination: Uses the relative position of 50-period and 200-period moving averages to determine market trends, confirming an uptrend when the short-term moving average is above the long-term moving average.
- Support Level Calculation: Calculates support levels using pivot point formula, utilizing weighted averages of the previous period's high, low, and closing prices.
- False Breakout Confirmation: Generates long signals when price briefly breaks below support during an uptrend and then closes above it.
- Risk Management: Uses 14-period ATR to calculate dynamic stop-loss positions, ensuring wider stops during increased market volatility.
- Profit Targets: Calculates profit targets using the highest price of the previous 10 periods to ensure adequate profit potential.
Strategy Advantages
- Trend Following: The strategy ensures trading in the direction of the main trend through the moving average system, improving win rates.
- Dynamic Risk Control: Uses ATR to dynamically adjust stop-loss positions, adapting to different market environments.
- Clear Trading Signals: Support level false breakout patterns have clear identification criteria, reducing subjective judgment.
- Reasonable Risk-Reward Ratio: Ensures good risk-reward ratios through dynamic stop-losses and historically-based profit targets.
- Systematic Operation: Clear strategy logic, easy to implement programmatically and backtest.
Strategy Risks
- False Signal Risk: May generate numerous false breakout signals in ranging markets, increasing trading costs.
- Trend Reversal Risk: Moving average systems react slowly at trend reversal points, potentially causing delayed entries.
- Stop-Loss Range Risk: ATR stops may result in larger losses when volatility suddenly increases.
- Profit Target Setting Risk: Fixed-period historical highs may not accurately reflect current market conditions.
Strategy Optimization Directions
- Add Filtering Conditions: Can add volume confirmation indicators to improve signal reliability.
- Optimize Moving Average Parameters: Adjust moving average periods based on different market characteristics to improve trend determination accuracy.
- Improve Stop-Loss Methods: Can implement composite stop-losses combining support levels to improve stop-loss effectiveness.
- Dynamic Profit Targets: Introduce dynamic profit target calculation methods to better adapt to market changes.
- Add Time Filters: Include trading time window screening to avoid trading during unfavorable periods.
Summary
The Multi-SMA Support Level False Breakout Strategy is a complete trading system combining trend following and price patterns. Through trend determination using moving average systems and support level false breakout pattern recognition, coupled with ATR dynamic stop-losses, it constructs a risk-controllable trading strategy. The core advantages of this strategy lie in its systematic operation process and clear risk management methods. Through continuous optimization and improvement, the strategy can better adapt to different market environments and improve trading results. In live trading applications, investors are advised to adjust strategy parameters based on their risk tolerance and market characteristics.
- 1