Multi-Indicator Cross-Trend Tracking and Volume-Price Combined Adaptive Trading Strategy

Overview
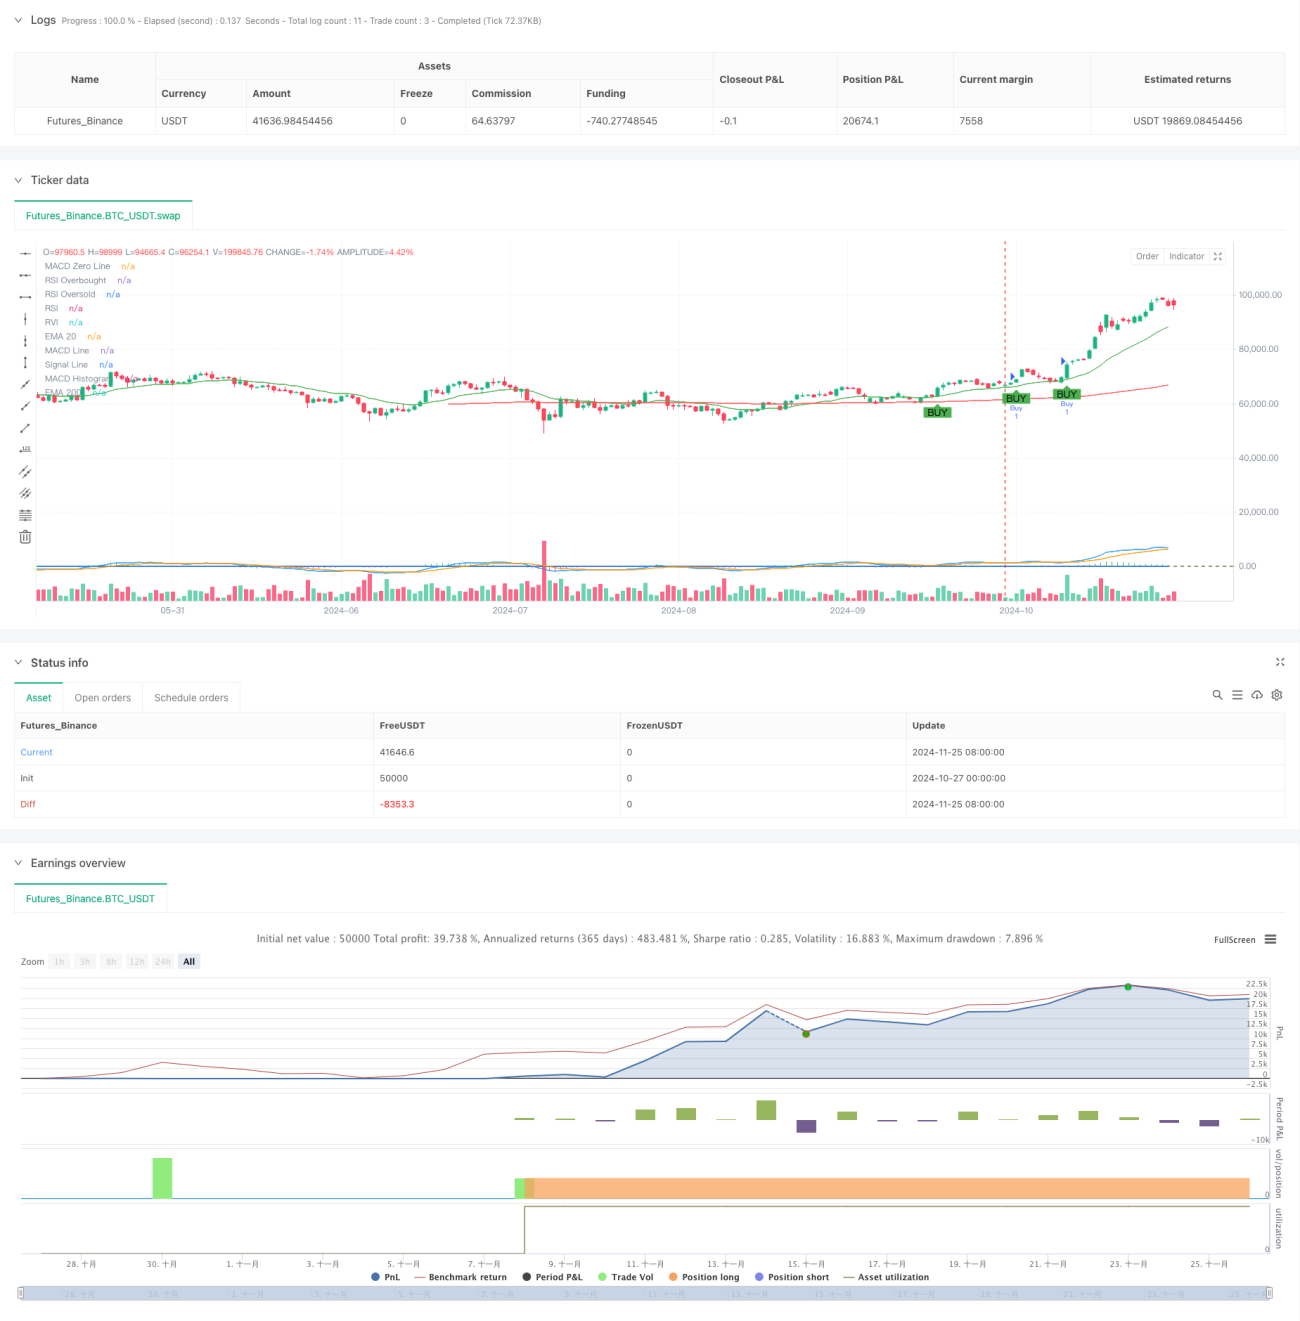
This strategy is a trend-following trading system that combines multiple technical indicators, using cross signals from MACD, RSI, RVI, EMA, and volume confirmation to identify market trends, with trailing stops for risk management. The strategy operates within specific price ranges and uses multiple signal combinations to improve trading accuracy and reliability.
Strategy Principles
The strategy employs a multi-layered signal verification mechanism with several key components: First, it uses 20-period and 200-period Exponential Moving Averages (EMA) to determine overall market trends; second, it utilizes MACD indicator (12,26,9) crossovers to capture trend turning points; third, it uses Relative Strength Index (RSI) and Relative Volatility Index (RVI) to confirm overbought/oversold conditions; finally, it validates trades through volume indicators. Buy conditions require simultaneous satisfaction of: MACD golden cross, RSI below 70, RVI above 0, price above both EMAs, and minimum volume requirements. Sell conditions are the opposite. The strategy also incorporates a trailing stop mechanism to protect profits through dynamic stop-loss adjustment.
Strategy Advantages
- Multiple signal verification mechanism greatly reduces false breakout risks
- Combines trend-following and oscillating indicators for stability in various market conditions
- Volume confirmation improves trading signal reliability
- Trailing stop mechanism effectively protects accumulated profits
- Price range restrictions prevent excessive trading in extreme market conditions
- Indicator parameters can be flexibly adjusted to market conditions
- System has good scalability and adaptability
Strategy Risks
- Multiple conditions might cause missing important trading opportunities
- May generate frequent false signals in sideways markets
- Fixed price range restrictions might miss important breakout opportunities
- Over-reliance on technical indicators may ignore fundamental factors
- Trailing stops might be triggered prematurely during volatile periods
Strategy Optimization Directions
- Introduce adaptive parameter mechanisms to dynamically adjust indicator parameters based on market volatility
- Add market sentiment indicators to improve prediction of market turning points
- Develop dynamic price range judgment mechanisms for greater flexibility
- Add time period filters to avoid trading during unfavorable sessions
- Optimize stop-loss mechanism by considering volatility-based dynamic stops
- Add risk management module for more comprehensive position management
Summary
This strategy constructs a relatively complete trading system through the combination of multiple technical indicators. While it has certain limitations, the strategy has good practical value through reasonable parameter optimization and risk management. Future improvements can be made by introducing more adaptive mechanisms and risk control measures to enhance stability and profitability.
- 1