RSI Dynamic Exit Level Momentum Trading Strategy

Overview
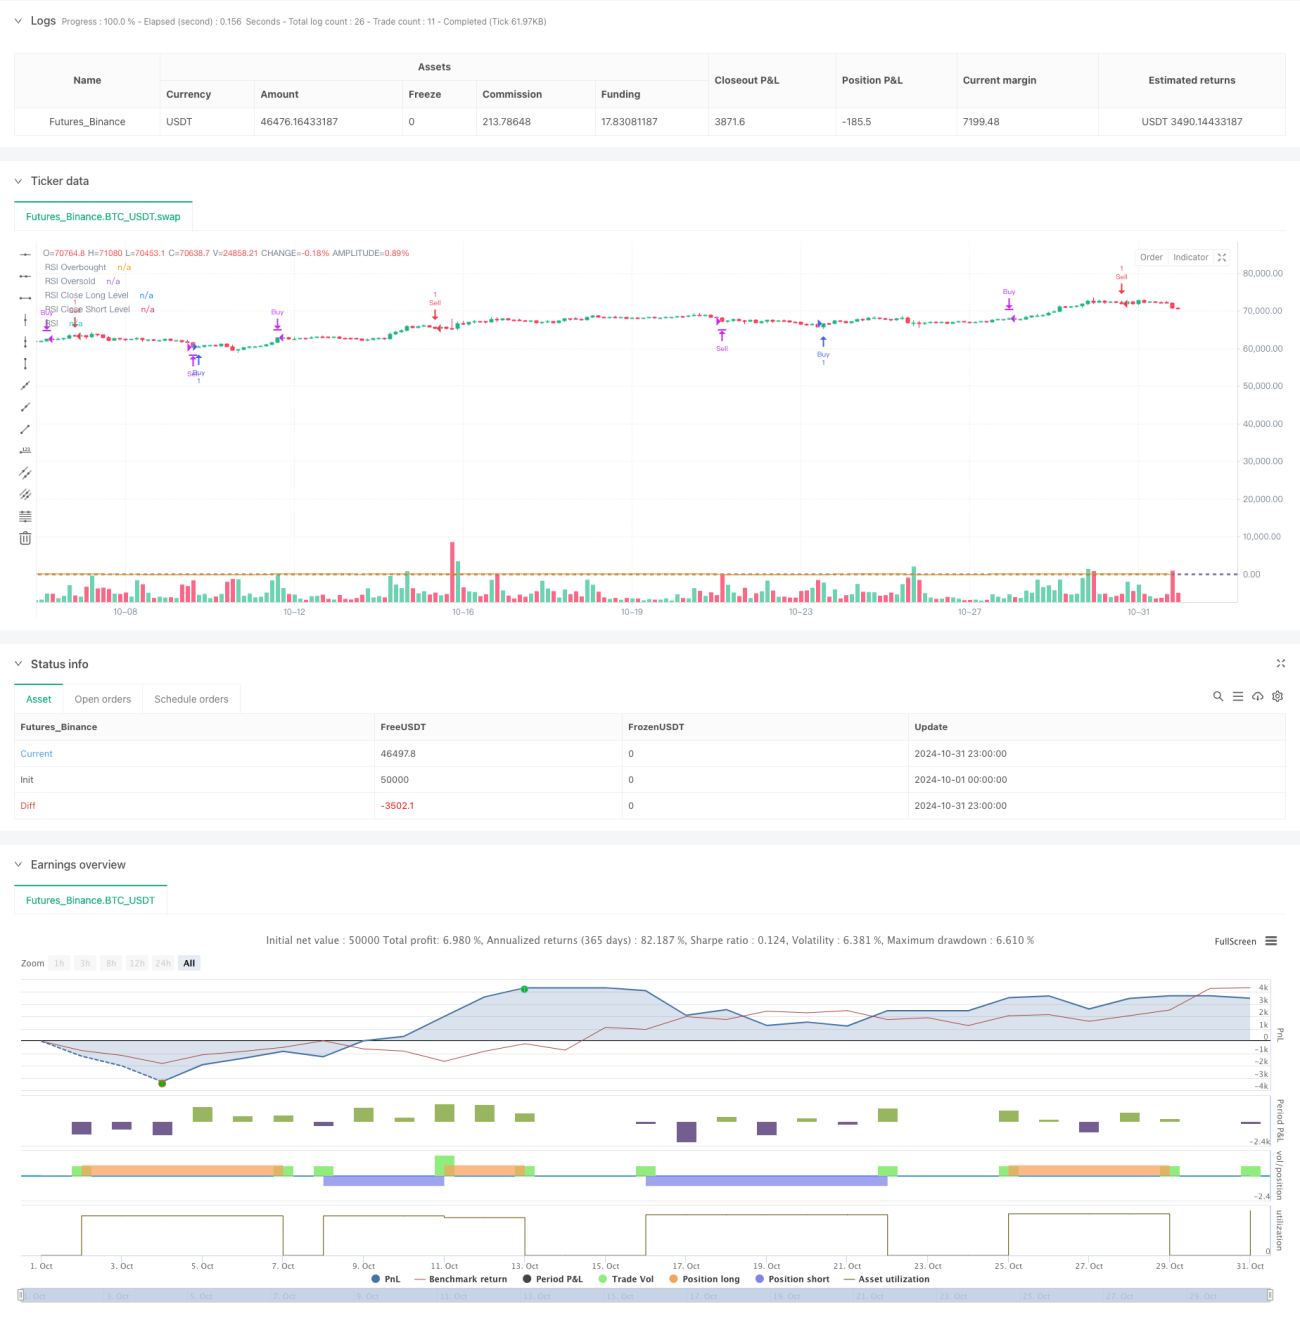
This strategy is a dynamic exit system based on the Relative Strength Index (RSI), capturing market trends through dynamic entry and exit conditions. The strategy generates trading signals when RSI breaks through overbought and oversold levels, incorporating a unique dynamic exit mechanism by setting exit conditions at different RSI levels to optimize trading performance. It employs a complete long-short trading system capable of capturing opportunities in both market directions.
Strategy Principles
The core logic includes several key components:
- Signal Generation: Uses RSI overbought/oversold levels (70/30) as primary trading signals. Buy signals are generated when RSI crosses above 30, sell signals when crossing below 70.
- Position Management: Implements a single position principle, ensuring only one directional position at any time to effectively control risk exposure.
- Dynamic Exit Mechanism: Sets differentiated RSI exit levels (60 for longs/40 for shorts), with this asymmetric design better adapting to market trend characteristics.
- Visualization Module: Plots RSI line, overbought/oversold levels, and exit levels on the chart for intuitive market state understanding.
Strategy Advantages
- Systematic Trading: Fully systematic approach eliminates emotional interference from subjective judgment.
- Risk Control: Effective risk management through single position principle and dynamic exit mechanism.
- High Adaptability: RSI parameters and exit levels can be adjusted for different market characteristics.
- Bilateral Trading: Captures opportunities in both rising and falling markets.
- Visual Support: Intuitive chart display aids understanding of market conditions and strategy logic.
Strategy Risks
- Choppy Market Risk: May generate frequent trades in sideways markets, increasing transaction costs.
- Trend Continuation Risk: Early exits might miss larger trend opportunities.
- Parameter Sensitivity: Strategy performance is sensitive to RSI parameter and exit level settings.
- Slippage Impact: May face significant slippage risk during volatile market conditions.
Optimization Directions
- Introduce Trend Filters: Add trend indicators like moving averages to filter false signals.
- Dynamic Parameter Optimization: Automatically adjust RSI parameters and exit levels based on market volatility.
- Enhanced Position Management: Incorporate money management module to adjust position size based on market risk levels.
- Optimize Exit Mechanism: Consider adding trailing stop functionality for better profit protection.
Summary
This is a well-designed momentum trading strategy that captures market opportunities through RSI indicators and dynamic exit mechanisms. The strategy's main features are its high systematic nature, robust risk control, and strong adaptability. While inherent risks exist, there is significant room for improvement through parameter optimization and functional extensions. For investors seeking a robust trading system, this represents a worthy strategy framework to consider.
- 1