T3 Moving Average Trend Following Strategy with Trailing Stop Loss

Overview
This strategy is a comprehensive quantitative trading system that combines T3 Moving Average, trend following, and trailing stop loss mechanisms. The strategy identifies market trend direction using T3 Moving Average, confirms signals using Lemon Trend Indicator and TDFI indicator, and incorporates a risk management system that combines trailing stops with fixed stops to capture trends and effectively control risks.
Strategy Principles
The strategy consists of three main components: trend identification, signal confirmation, and risk management. First, it uses T3 Moving Average as the primary trend identification tool, which reduces lag while maintaining smoothness through six-fold exponential moving average calculations. Second, it calculates price volatility ranges using the Lemon Trend Indicator and filters signals with the TDFI indicator, generating trade signals only when price breaks through the volatility range and TDFI confirms. Finally, the strategy employs a combination of trailing and fixed stops for risk management, with trailing stops activating after price reaches threshold levels while maintaining fixed stops as protection.
Strategy Advantages
- Multiple signal confirmation mechanisms improve trading accuracy
- T3 Moving Average reduces the impact of false breakouts
- Flexible risk management system that protects profits while allowing trends to develop
- Supports partial position exits for staged profit realization
- Highly adjustable parameters for optimization in different market conditions
Strategy Risks
- Complex T3 Moving Average calculations may introduce computational delays
- Multiple signal confirmations might cause missed trading opportunities
- Trailing stops may trigger prematurely during volatile market conditions
- Requires significant price movements to generate effective signals
- May generate frequent false signals in ranging markets
Optimization Directions
- Introduce volatility indicators to adjust trailing stop parameters
- Add market environment recognition module for different parameter sets
- Optimize TDFI indicator calculation periods for improved signal timing
- Consider incorporating volume factors for signal confirmation
- Research adaptive partial profit-taking ratio mechanisms
Conclusion
This is a comprehensively designed trend-following strategy that ensures reliable trading signals and effective risk management through multiple technical indicators. The strategy's modular design provides good extensibility and optimization potential, making it suitable as a foundation for medium to long-term trend following systems. In practical application, it is recommended to optimize parameters based on specific trading instruments and market conditions.
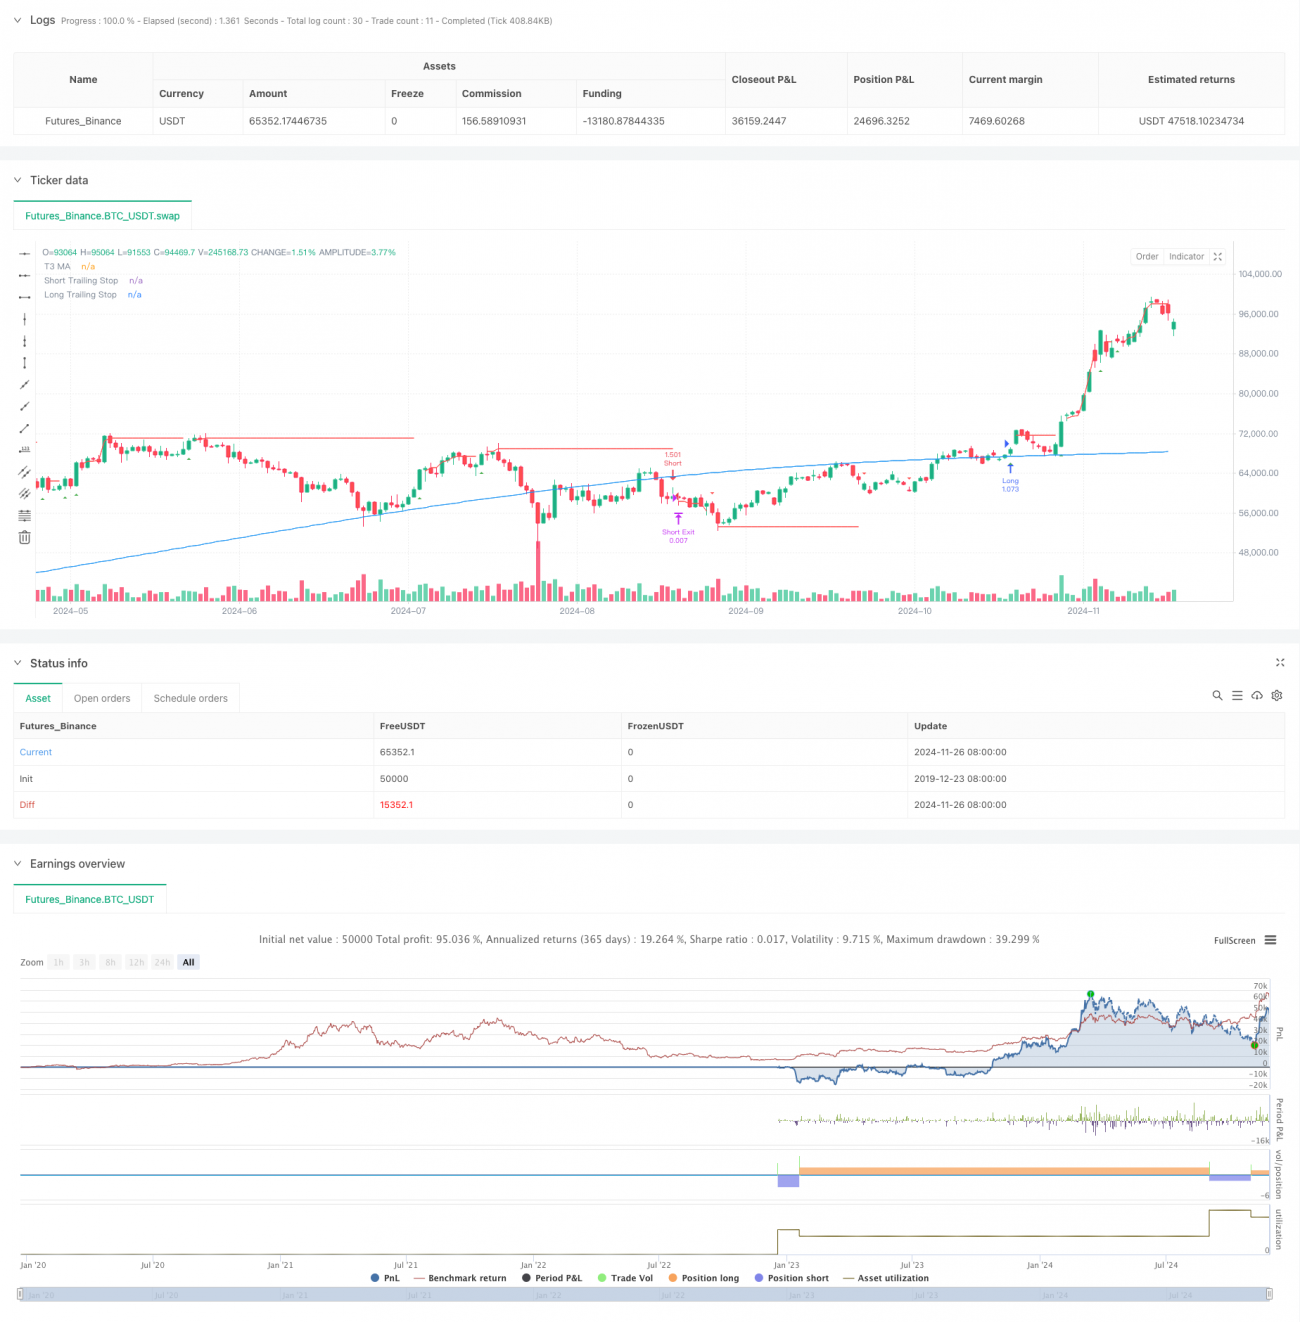
/*backtest
start: 2019-12-23 08:00:00
end: 2024-11-27 00:00:00
period: 1d
basePeriod: 1d
exchanges: [{"eid":"Futures_Binance","currency":"BTC_USDT"}]
*/

//@version=5
strategy("Lemon Trend Strategy", overlay=true, initial_capital=10000, default_qty_type=strategy.percent_of_equity, default_qty_value=100)

// Input parameters- 1