Dual Moving Average MACD Crossover Date-Adjustable Quantitative Trading Strategy

Overview
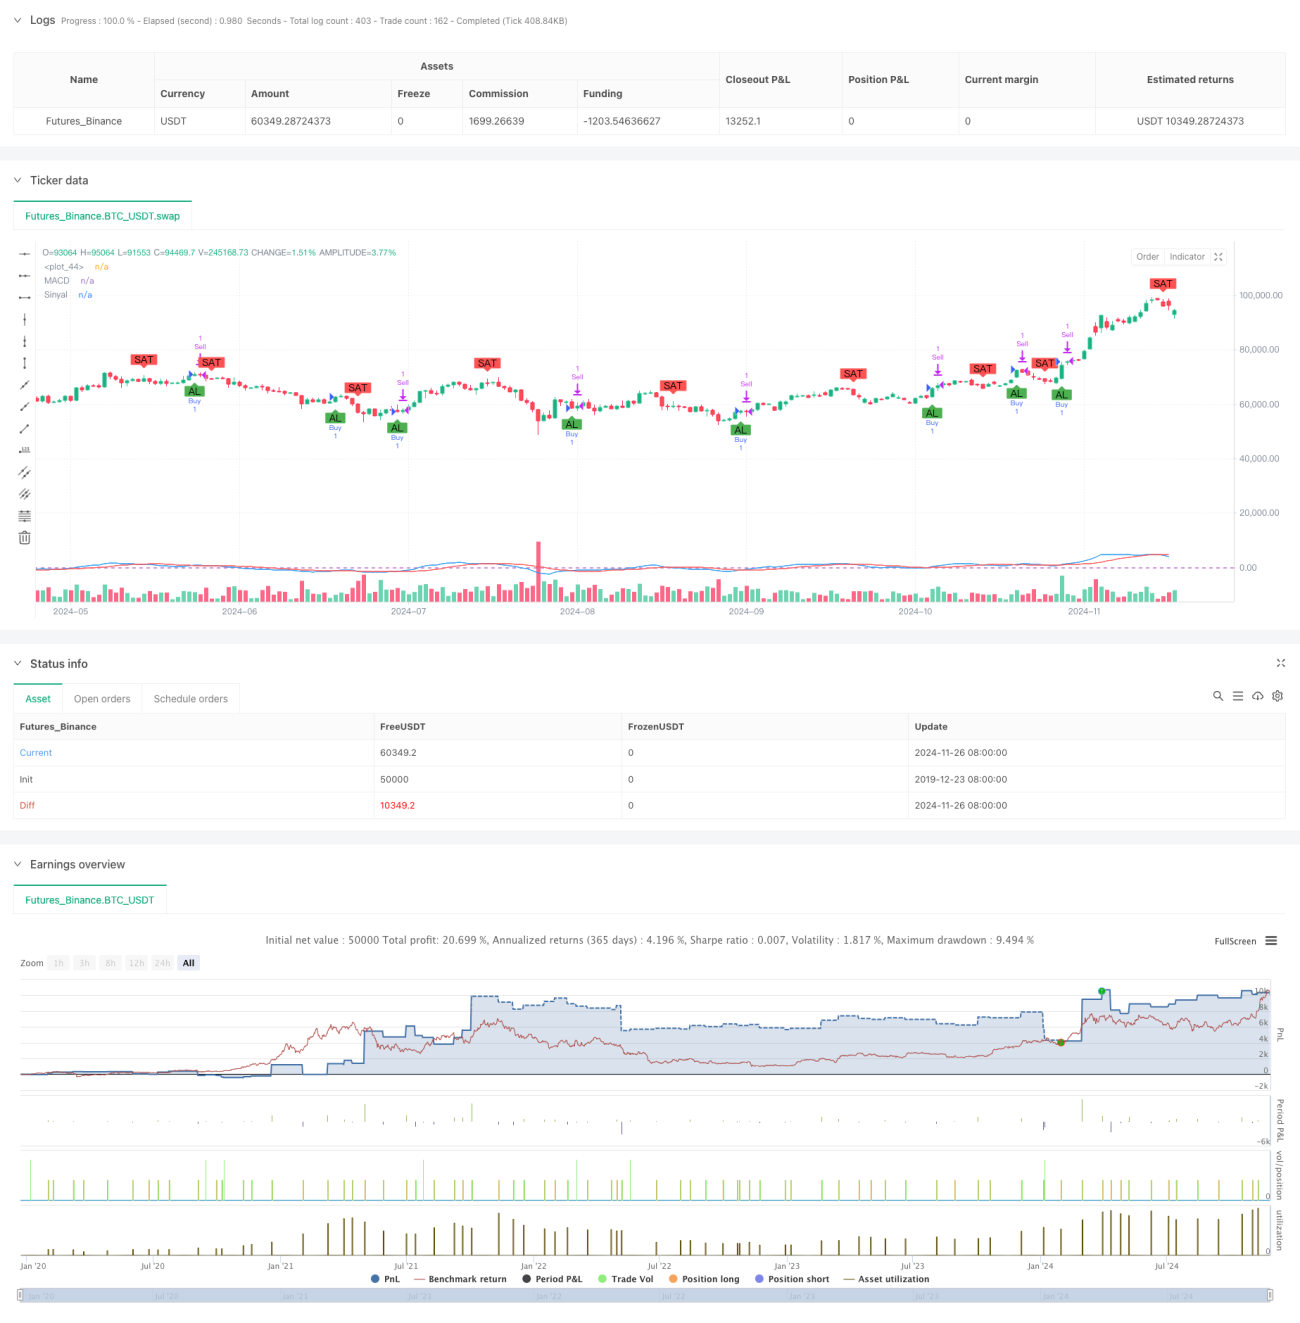
This is a quantitative trading strategy based on the MACD indicator that executes trades within a specified time range. The core strategy utilizes fast and slow moving averages to calculate MACD values and generates signals based on crossovers with the signal line. The strategy also incorporates stop-loss and take-profit mechanisms to control risk and lock in profits.
Strategy Principles
The strategy employs 8-period and 16-period exponential moving averages (EMA) to calculate MACD values, and uses an 11-period simple moving average (SMA) as the signal line. Buy signals are generated when the MACD line crosses above the signal line, while sell signals occur on downward crosses. The strategy includes a 1% stop-loss and 2% take-profit setting, and only executes trades within a user-specified time range (default is full year 2023).
Strategy Advantages
- Time Flexibility: Users can precisely control the strategy's operational period through time range parameters, facilitating specific period backtesting and live trading.
- Comprehensive Risk Management: Integrated stop-loss and take-profit mechanisms effectively control risk exposure per trade.
- High Parameter Adjustability: All major indicator parameters are adjustable, including fast/slow moving average periods, signal line period, and stop-loss/take-profit percentages.
- Clear Signals: Trading signals based on MACD crossovers are clear and easy to monitor and execute.
Strategy Risks
- Lag Risk: Due to the moving average system, signals have inherent lag, potentially missing optimal entry points.
- Oscillation Market Risk: May generate frequent false signals in range-bound markets, leading to overtrading.
- Fixed Stop-Loss Risk: Using fixed percentage stops may not adequately adapt to different market conditions.
- Time Dependency: Strategy performance may be influenced by specific time period market characteristics, challenging consistent performance across all periods.
Strategy Optimization Directions
- Introduce Trend Filters: Add long-period moving averages or ATR indicators for trend confirmation to reduce false signals.
- Dynamic Stop-Loss Mechanism: Consider using ATR or volatility for dynamic stop-loss placement to improve adaptability.
- Optimize Signal Confirmation: Add volume, RSI, or other auxiliary indicators to confirm signal validity.
- Time Period Optimization: Recommend implementing multiple time frame analysis to improve signal reliability.
- Position Management Enhancement: Introduce volatility-based dynamic position sizing system.
Conclusion
This is a well-structured quantitative trading strategy with clear logic. It generates trading signals through MACD crossovers, combined with time filtering and risk management to form a practical trading system. The strategy's high adjustability makes it suitable for further optimization and customization. Traders are advised to conduct thorough backtesting before live implementation and adjust parameters according to specific trading instruments and market conditions.
/*backtest
start: 2019-12-23 08:00:00
end: 2024-11-27 00:00:00
period: 1d
basePeriod: 1d
exchanges: [{"eid":"Futures_Binance","currency":"BTC_USDT"}]
*/

// This Pine Script™ code is subject to the terms of the Mozilla Public License 2.0 at https://mozilla.org/MPL/2.0/
// © sergengurgen83

//@version=5- 1