ADX Trend Breakout Momentum Trading Strategy

Overview
This is a quantitative trading strategy based on the Average Directional Index (ADX) and price breakouts. The strategy primarily monitors ADX indicator values to assess market trend strength and combines price breakout signals to capture market momentum. The strategy operates within specific trading sessions and implements risk management through stop-loss and daily trade limits.
Strategy Principles
The core logic includes the following key elements:
- ADX Monitoring: Uses the ADX indicator to evaluate trend strength, with ADX values below 17.5 indicating potential new trend formation.
- Price Breakout Detection: Tracks the highest closing price over the past 34 periods, triggering trade signals when current price breaks above this resistance.
- Session Management: Operates only during specified trading hours (0730-1430) to avoid low liquidity periods.
- Risk Control Mechanisms:
- Fixed dollar stop-loss to limit single trade losses
- Maximum of 3 trades per session limit
- Automatic position closure at session end
Strategy Advantages
- Trend Capture Capability: Effectively identifies early trend stages through ADX indicator and price breakout combination.
- Comprehensive Risk Management: Multiple risk control measures including fixed stop-loss, trade limits, and auto-close mechanism.
- High Automation: Clear strategy logic enables fully automated trading without manual intervention.
- Strong Adaptability: Parameters can be adjusted for different market conditions.
Strategy Risks
- False Breakout Risk: May experience consecutive stops in ranging markets.
- Parameter Dependency: Strategy effectiveness heavily relies on ADX threshold and lookback period settings.
- Time Restrictions: Trading only during specific sessions may miss opportunities.
- Stop-Loss Configuration: Fixed dollar stops may lack flexibility in different volatility environments.
Optimization Directions
- Dynamic Stop-Loss: Recommend implementing ATR-based dynamic stops for different market volatility conditions.
- Market Environment Filter: Add volatility filters to adjust or pause trading in high volatility environments.
- Entry Optimization: Consider adding volume confirmation to improve breakout signal reliability.
- Dynamic Parameter Adjustment: Implement adaptive adjustment mechanisms for ADX thresholds and lookback periods.
Summary
This is a well-structured trend-following strategy with clear logic. It captures market trends by combining ADX indicators with price breakouts under an effective risk management framework. While there is room for optimization, the strategy's foundation is robust and suitable as a basic component of a quantitative trading system. Traders are advised to conduct thorough backtesting and parameter optimization before live trading, and make specific improvements based on market conditions.
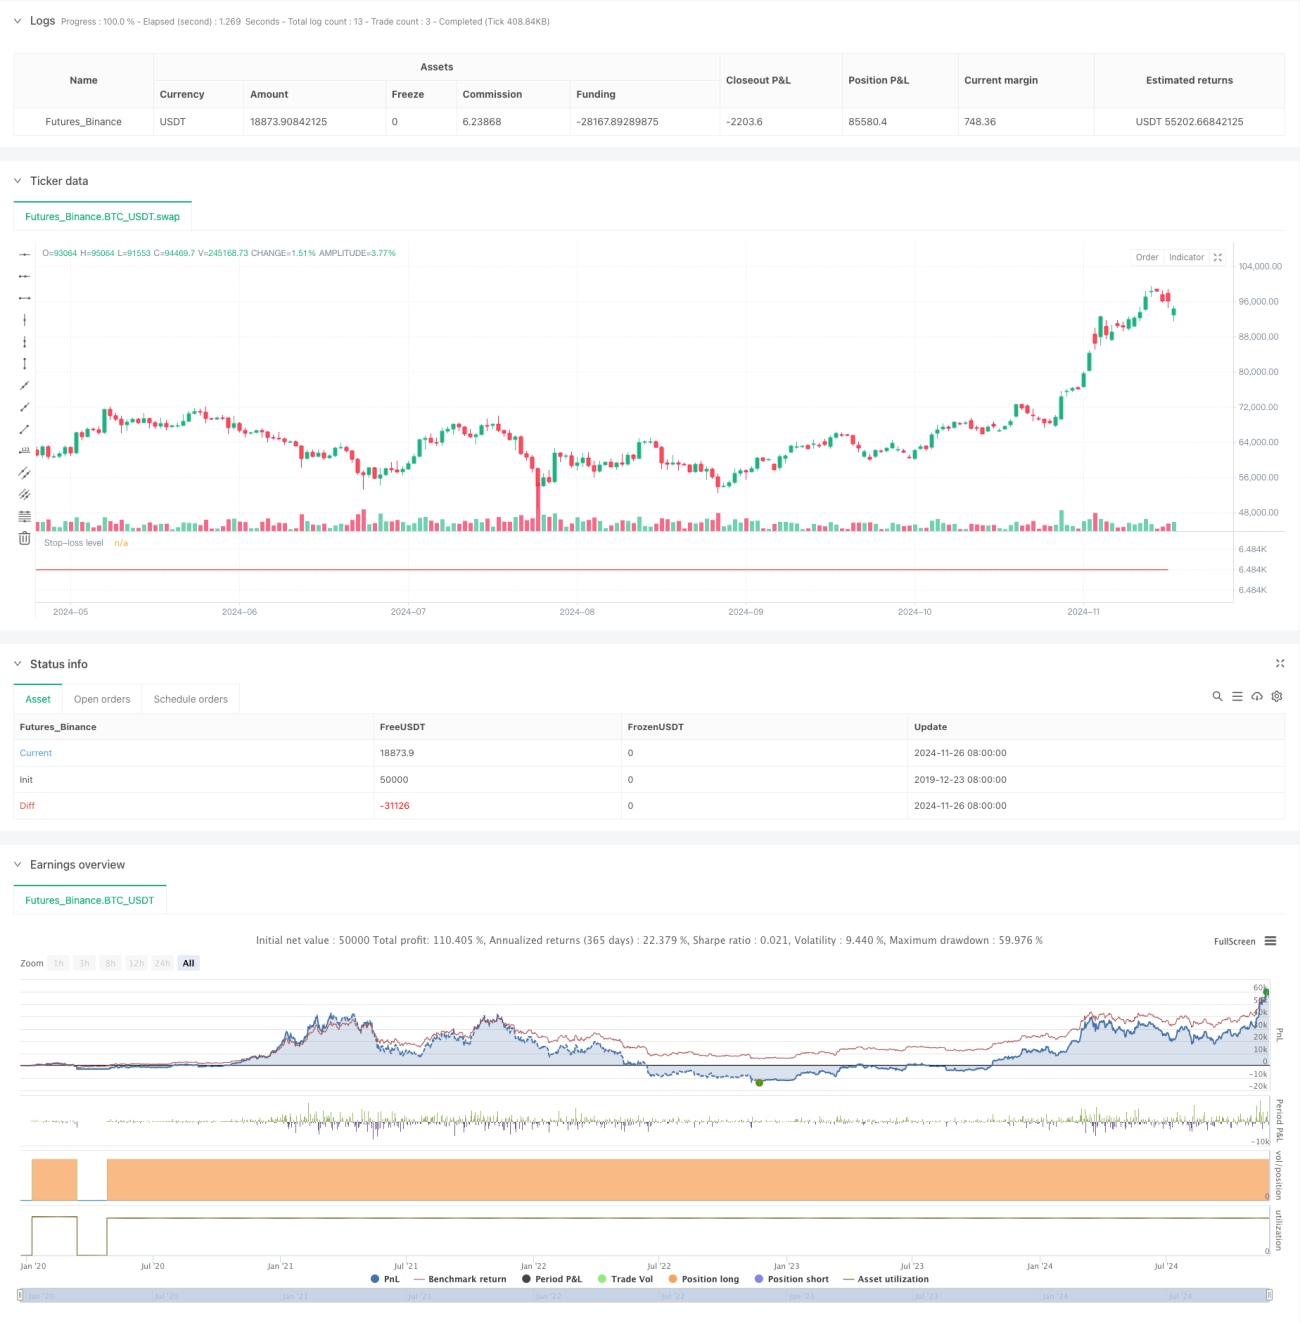
/*backtest
start: 2019-12-23 08:00:00
end: 2024-11-27 00:00:00
period: 1d
basePeriod: 1d
exchanges: [{"eid":"Futures_Binance","currency":"BTC_USDT"}]
*/

// This Pine Script™ code is subject to the terms of the Mozilla Public License 2.0 at https://mozilla.org/MPL/2.0/
// © HuntGatherTrade
// ========================
// NQ 30 minute, ES 30 minute- 1