RSI-MACD Multi-Signal Trading System with Dynamic Stop Management

Overview
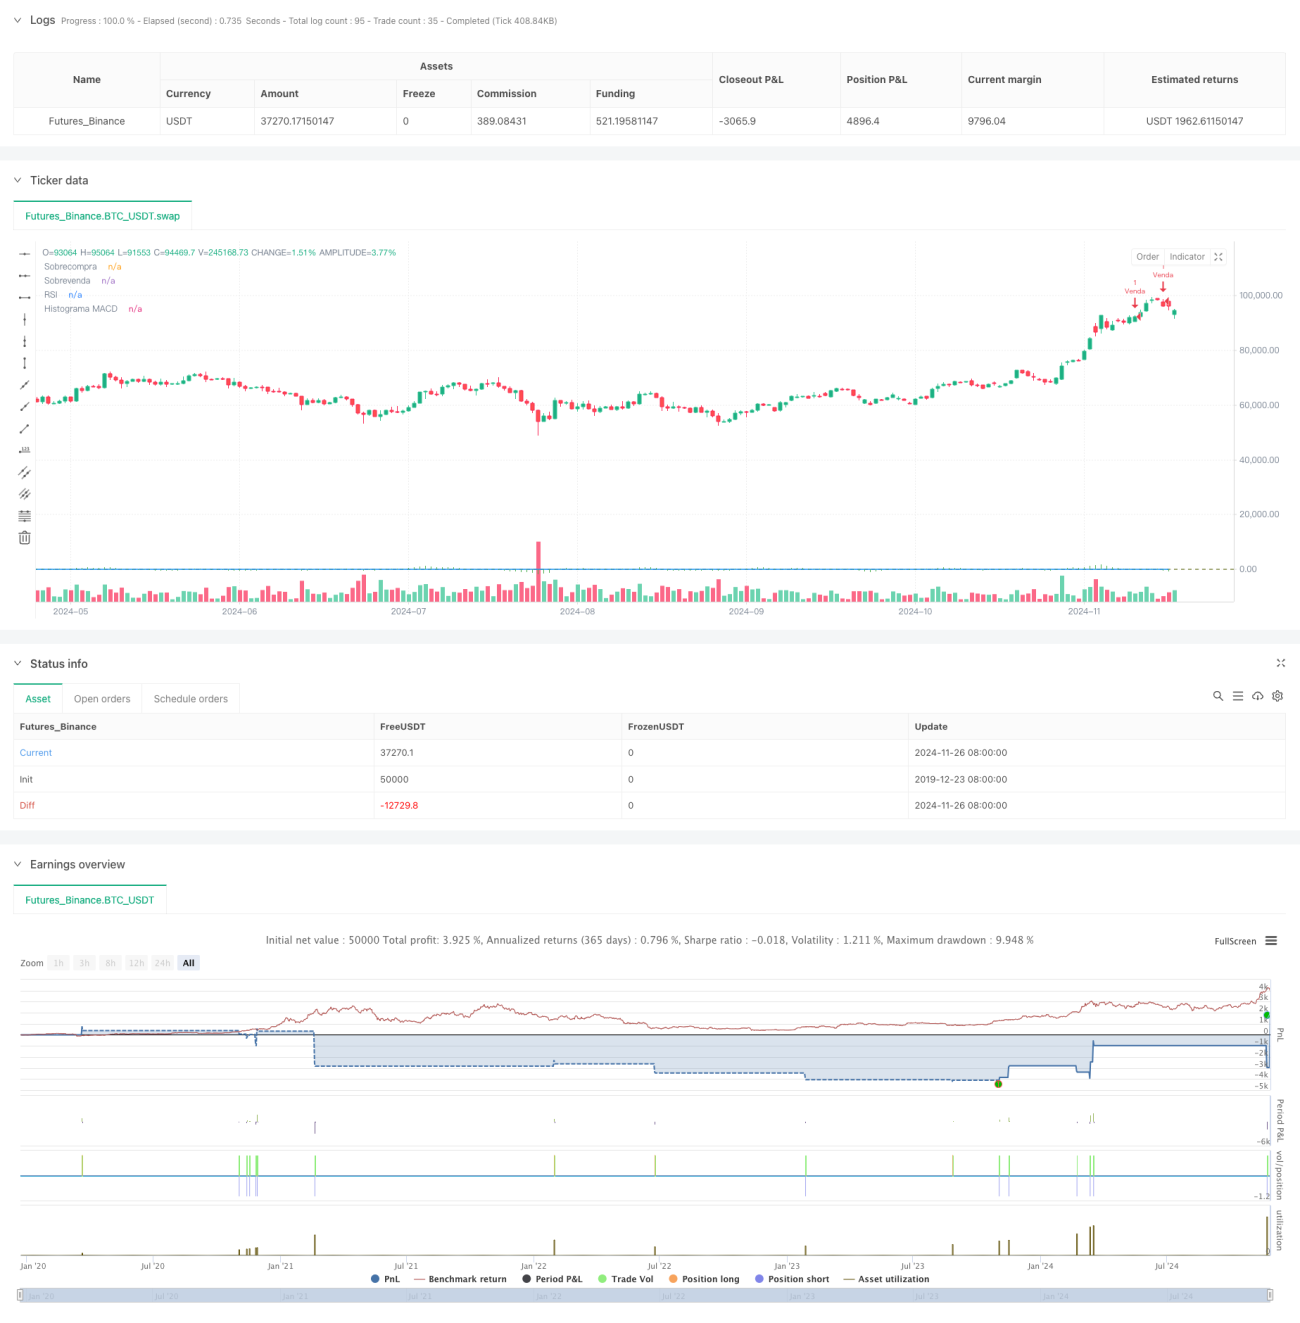
This strategy is a technical analysis-based trading system that combines RSI (Relative Strength Index) and MACD (Moving Average Convergence Divergence) dual signal confirmation mechanism, seeking trading opportunities in overbought and oversold zones while employing dynamic stop management. The strategy is designed for short-term trading and is suitable for capturing opportunities in fast-moving markets.
Strategy Principle
The strategy utilizes two classic technical indicators - RSI and MACD - to construct a trading signal system. Buy signals are triggered when RSI falls below 35 (oversold zone) and MACD shows a golden cross; sell signals are triggered when RSI rises above 70 (overbought zone) and MACD shows a death cross. The system implements a risk management mechanism with 300 points stop-loss and 600 points take-profit, creating a 2:1 reward-to-risk ratio that helps achieve positive expected returns in long-term trading.
Strategy Advantages
- Dual signal confirmation mechanism improves trading accuracy
- RSI and MACD combination effectively filters false signals
- Fixed risk-reward ratio promotes long-term stable profits
- Adjustable strategy parameters provide good adaptability
- Label system visualizes trading signals for backtest analysis
- Short-term settings suitable for capturing quick opportunities
Strategy Risks
- Choppy markets may generate frequent signals leading to consecutive losses
- Fixed stop-loss may result in significant losses during volatile periods
- RSI and MACD are lagging indicators, potentially missing optimal entry points
- Short-term trading is susceptible to market noise
- Lack of time filters may lead to trading during unsuitable periods
Strategy Optimization Directions
- Introduce trend filters to avoid trading in ranging markets
- Add volatility indicators for dynamic stop-loss adjustment
- Implement trading time filters to avoid low liquidity periods
- Consider adding signal confirmation time requirements to reduce false signals
- Optimize position sizing system based on market volatility
- Add trailing stop functionality for better profit protection
Summary
The strategy builds a relatively reliable trading system by combining RSI and MACD indicators, complemented by reasonable stop-loss and take-profit settings, showing practical application value. However, it still requires optimization based on actual market conditions, especially in risk control and signal filtering aspects. Successful strategy implementation requires traders to have a deep understanding of the market and the ability to flexibly adjust parameters to adapt to different market environments.
- 1