Triple EMA Crossover Trading Strategy with Dynamic Stop-Loss and Take-Profit

Overview
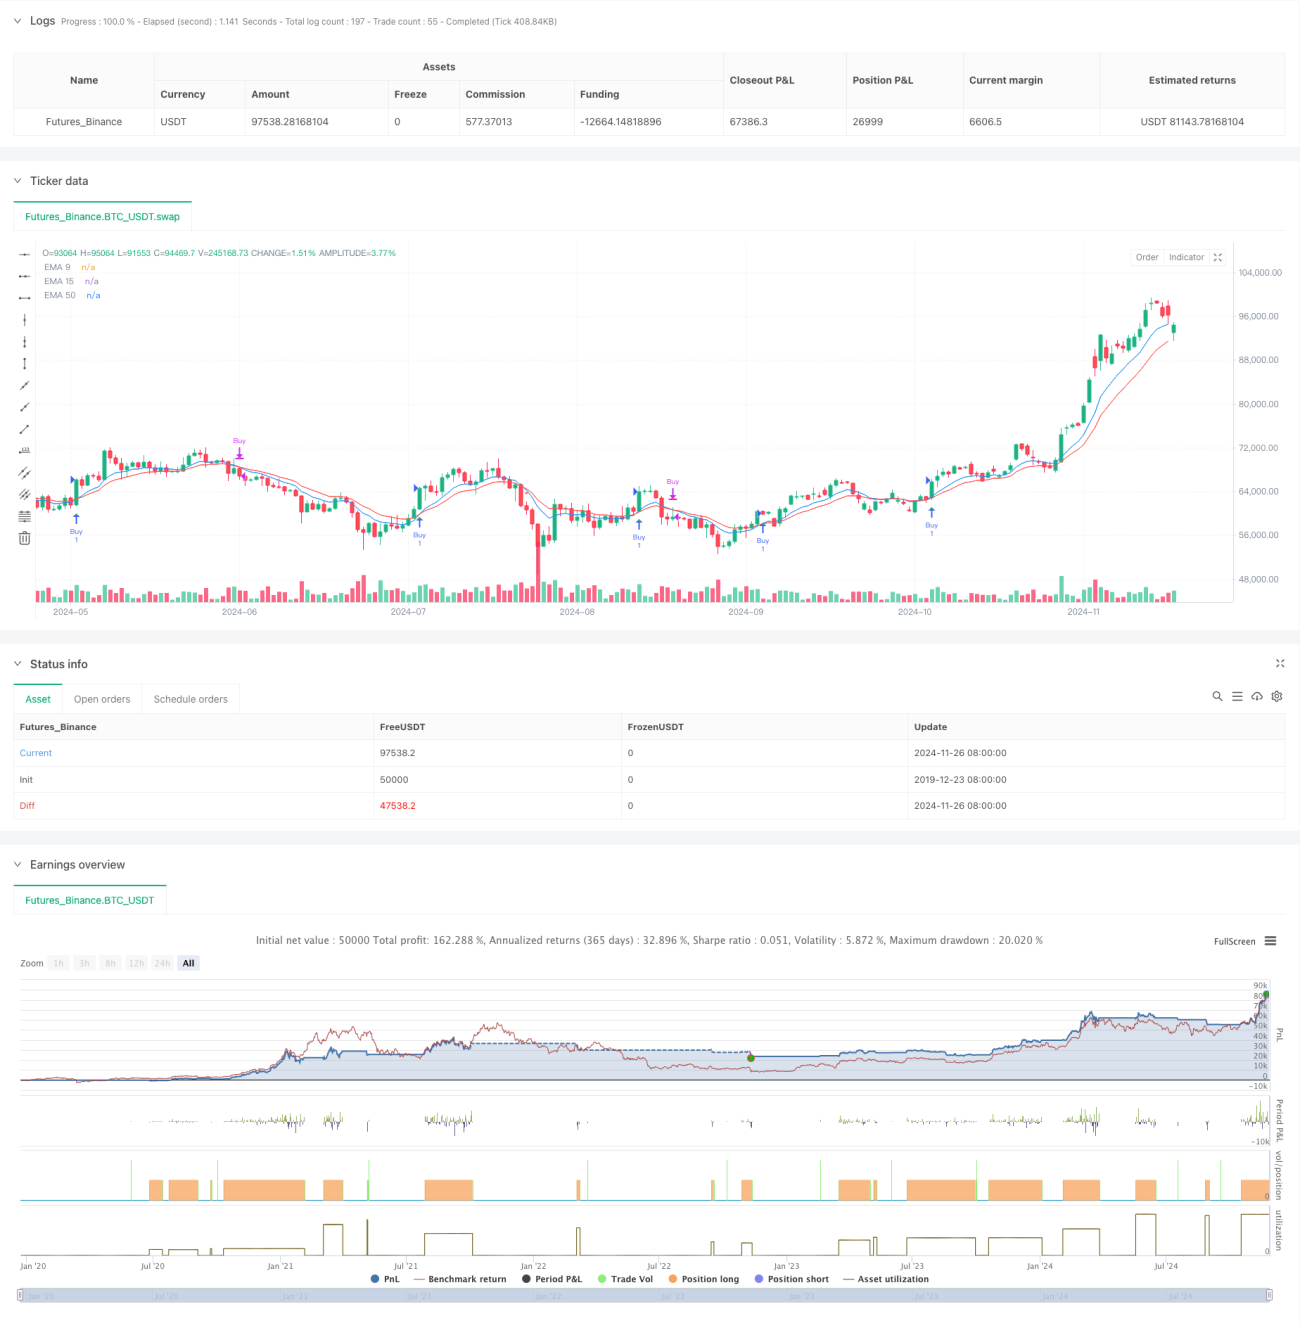
This is a trend-following strategy based on triple Exponential Moving Average (EMA) crossover signals. The strategy combines 9-period, 15-period, and 50-period EMAs, utilizing crossover signals between short-term and medium-term EMAs while using the long-term EMA as a trend filter, coupled with dynamic stop-loss and take-profit mechanisms for risk management. This strategy design fully considers both trend-following and risk management requirements, making it suitable for medium to long-term trading.
Strategy Principle
The core logic relies on monitoring crossover signals between the 9-period and 15-period EMAs while using the 50-period EMA as a trend confirmation indicator. Specifically:
- Long entry signals are generated when price is above the 50-period EMA and the 9-period EMA crosses above the 15-period EMA
- Exit signals occur when price is below the 50-period EMA and the 9-period EMA crosses below the 15-period EMA
- Each trade incorporates fixed stop-loss and take-profit levels to protect capital and secure profits
- The system includes alert functionality to notify traders of signal generation in real-time
Strategy Advantages
- Multiple confirmation mechanism: Using three EMAs effectively reduces false breakout risks
- Strong trend-following capability: The 50-period EMA filter ensures trade direction aligns with the main trend
- Comprehensive risk management: Built-in stop-loss and profit targets effectively control per-trade risk
- Clear signals: Crossover signals are distinct and easy to execute
- High automation level: Supports automated trading and alerts, reducing manual intervention
- Adjustable parameters: Key parameters can be optimized for different market characteristics
Strategy Risks
- Choppy market risk: May generate frequent false signals during consolidation phases
- Lag risk: Moving averages have inherent lag, potentially missing optimal entry points
- Fixed stop-loss risk: Static stop levels may not adapt to changing market volatility
- Over-reliance on technical indicators: Lack of fundamental analysis may lead to missed major turning points
- Money management risk: Improper stop-loss and take-profit settings can impact overall returns
Strategy Optimization Directions
- Dynamic stop-loss enhancement: Incorporate ATR indicator for dynamic stop-loss adjustment based on market volatility
- Signal filtering improvement: Add volume and RSI indicators to filter false signals
- Parameter adaptation: Automatically adjust EMA periods based on market volatility
- Time-based optimization: Adjust strategy parameters for different market sessions
- Position management refinement: Introduce dynamic position sizing based on market risk levels
Summary
This is a well-designed trend-following strategy with clear logic. The combination of multiple EMAs ensures signal reliability while achieving effective trend following. The built-in risk management mechanisms provide stability for strategy operation. Through the suggested optimization directions, there is room for further improvement. The strategy is suitable for traders seeking steady returns, but requires thorough testing and parameter optimization for specific market characteristics before implementation.
- 1