
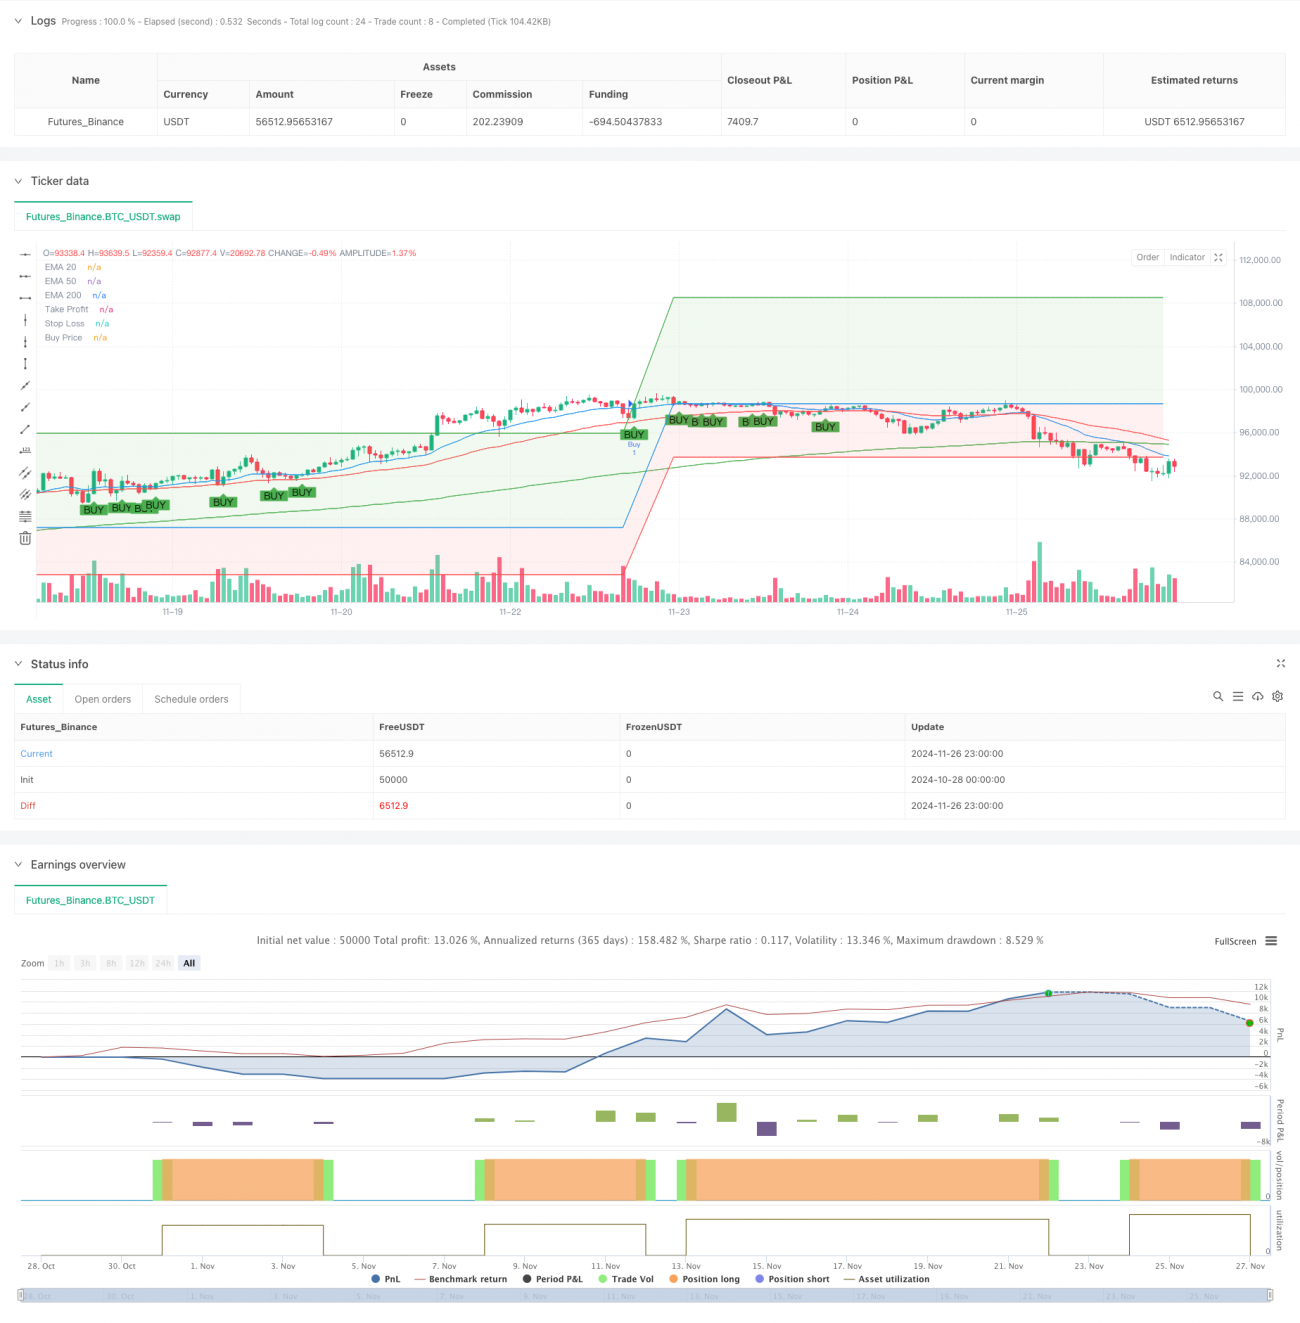
Overview
This is a trend following strategy based on multiple timeframe EMA crossovers. The strategy primarily relies on the crossover relationships between 20, 50, and 200-period Exponential Moving Averages (EMAs) and price-EMA relationships to determine entry points, while incorporating percentage-based take-profit and stop-loss levels for risk management. This strategy is particularly effective on larger timeframes such as 1-hour, daily, and weekly charts.
Strategy Principles
The core logic is based on a multiple moving average system and price action analysis:
- Uses three different period EMAs (20, 50, 200) to build a trend identification system
- Entry conditions require all of the following:
- Price breaks and closes above the 20-period EMA
- 20-period EMA is above the 50-period EMA
- 50-period EMA is above the 200-period EMA
- Risk management uses fixed percentage methods:
- Take profit is set at 10% above entry price
- Stop loss is set at 5% below entry price
Strategy Advantages
- Multiple confirmation mechanism improves reliability
- Multiple validations through triple EMAs and price breakout
- Reduces false signal interference
- Comprehensive risk management system
- Preset take-profit and stop-loss levels
- Reasonable risk-reward ratio (1:2)
- High adaptability
- Applicable across multiple timeframes
- Particularly suitable for medium to long-term trend trading
Strategy Risks
- Poor performance in ranging markets
- May trigger frequent stop losses in sideways markets
- Recommended for use in clear trending conditions
- Lag risk
- Moving average system has inherent lag
- May miss some trend starting points
- Fixed take-profit and stop-loss limitations
- Fixed percentages may not suit all market conditions
- Recommend dynamic adjustment based on volatility
Strategy Optimization Directions
- Incorporate volatility indicators
- Use ATR for dynamic take-profit and stop-loss adjustment
- Improve strategy market adaptability
- Add trend strength filtering
- Include ADX or other trend strength indicators
- Improve entry signal quality
- Optimize EMA periods
- Adjust EMA parameters based on different market characteristics
- Provide parameter optimization range suggestions
Summary
This is a well-designed trend following strategy with clear logic. Through the combination of multiple technical indicators, it ensures both strategy reliability and clear risk management solutions. The strategy is particularly suitable for larger timeframe charts and has unique advantages in capturing medium to long-term trends. Through the suggested optimization directions, there is room for further improvement. Traders are advised to thoroughly test the strategy in a backtesting system before live trading and adjust parameters according to specific trading instrument characteristics.
- 1