
Overview
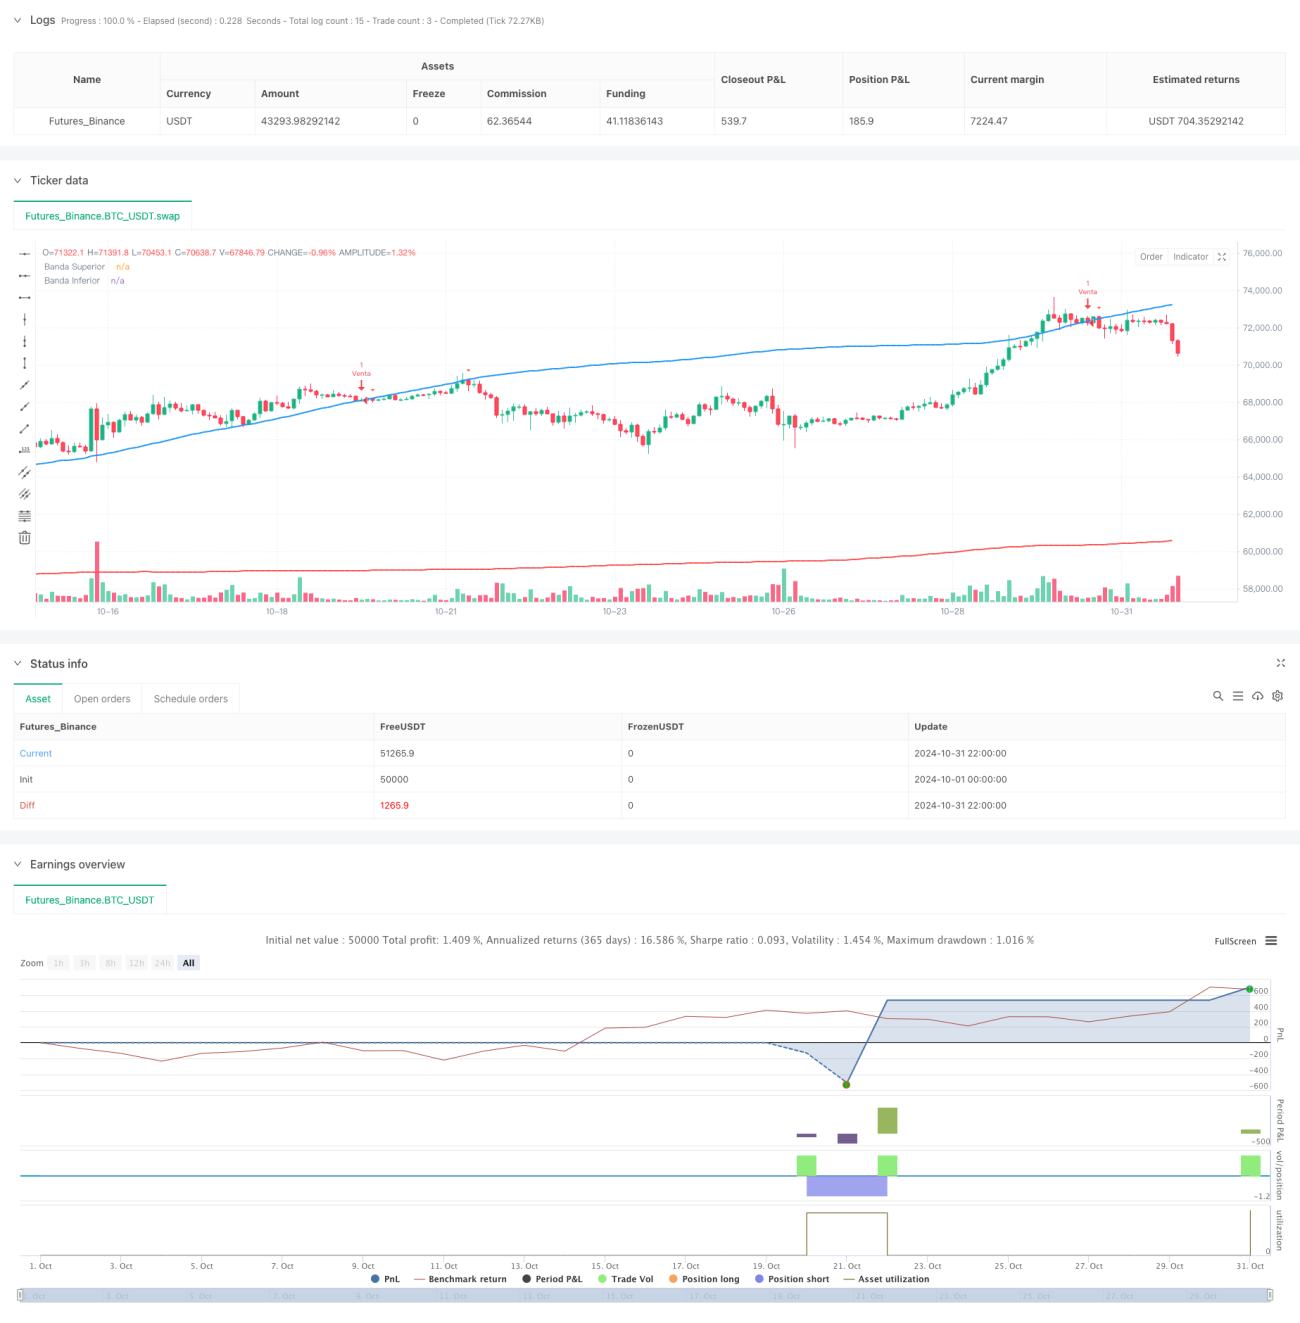
This strategy is a volatility band trading system built on a 300-period Exponential Moving Average (EMA). By combining EMA and standard deviation, it forms a Bollinger Bands-like dynamic volatility range to capture market overbought and oversold opportunities. The strategy generates trading signals through price crosses with the volatility bands and sets profit targets based on percentage gains.
Strategy Principles
The core of the strategy establishes a price center using 300-period EMA and constructs volatility bands using standard deviation. It generates long signals when price breaks below the lower band (oversold) and short signals when price breaks above the upper band (overbought). Specifically:
- Uses 300-period EMA to establish long-term trend baseline
- Calculates 300-period price standard deviation and constructs bands at 2 standard deviations
- Opens long positions when price breaks below lower band, with profit target at 0.98% above entry
- Opens short positions when price breaks above upper band, with profit target at 0.98% below entry
- Displays trading signals through graphical interface with real-time alerts
Strategy Advantages
- Long-period EMA effectively filters short-term market noise
- Dynamic volatility bands adapt to changes in market volatility
- Clear trading rules avoid subjective judgment interference
- Comprehensive profit-taking mechanism for effective risk control
- Intuitive graphical interface for observing market conditions
- Real-time alerts help capture trading opportunities promptly
Strategy Risks
- Long-period moving averages have lag, may miss rapid market moves
- May generate frequent false breakouts in ranging markets
- Fixed percentage profit targets may exit too early, missing larger moves
- Lack of stop-loss mechanism poses risks during sharp trend reversals
Recommended risk management measures:
- Incorporate short-period indicators for confirmation
- Add trend confirmation filters
- Implement dynamic profit target adjustment
- Add stop-loss mechanisms
Strategy Optimization Directions
- Introduce trend confirmation indicators like MACD, RSI to filter false breakouts
- Use ATR for dynamic adjustment of profit and stop levels
- Add trailing stop functionality to better lock in profits
- Optimize length parameters to find optimal period combinations
- Consider adding volume indicators to improve signal reliability
- Develop adaptive parameter mechanisms to enhance strategy adaptability
Summary
The strategy captures market overbought and oversold opportunities through EMA volatility bands, with clear trading rules and simple operation. However, risk control needs attention in practical application, and it's recommended to enhance strategy stability through additional indicators and parameter optimization. The overall design is reasonable, with good practical value and optimization potential.
- 1