Multi-Level Fibonacci EMA Trend Following Strategy

Overview
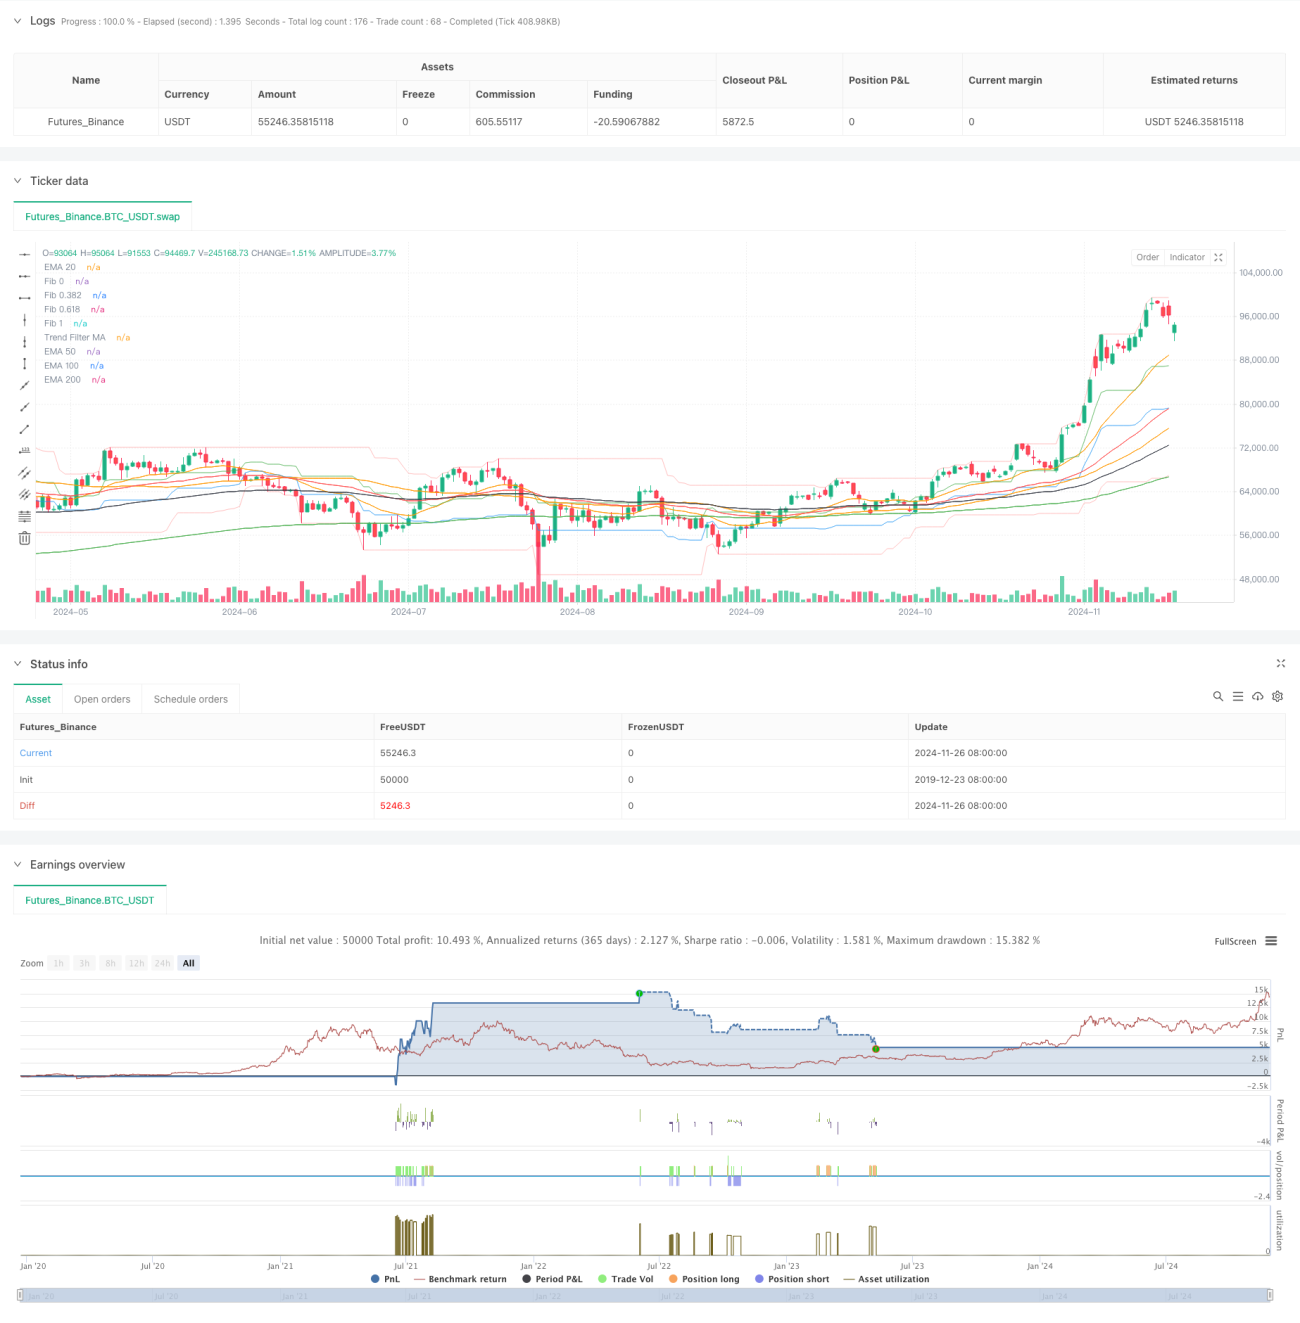
This strategy is a trend-following trading system that combines Fibonacci retracements, multiple exponential moving averages, and volume analysis. It identifies potential trading opportunities by analyzing price positions at different Fibonacci retracement levels (0, 0.382, 0.618, 1), confirming trends with multi-period EMAs (20/50/100/200), and filtering through volume thresholds. The system includes a comprehensive risk management mechanism with fixed percentage stop-loss and take-profit settings.
Strategy Principles
The core logic is based on multi-level technical analysis:
- Uses a 30-period lookback window to calculate Fibonacci retracement levels, establishing support and resistance framework
- Constructs a multi-level trend confirmation system using 20/50/100/200 period exponential moving averages
- Triggers long signals when price approaches the 0.382 Fibonacci level with volume above threshold and price above moving averages
- Triggers short signals when price approaches the 0.618 Fibonacci level with volume above threshold and price below moving averages
- Implements percentage-based take-profit and stop-loss mechanisms at 6% and 3% respectively
Strategy Advantages
- Multi-dimensional Analysis: Combines price patterns, trends, and volume for improved signal reliability
- Comprehensive Risk Management: Clear stop-loss and take-profit conditions effectively control risk per trade
- Thorough Trend Confirmation: Multiple moving average system accurately judges trend strength and direction
- Strict Signal Filtering: Requires simultaneous satisfaction of price, moving average, and volume conditions
- High Visualization: Clear label system marks entry and exit points for analysis and optimization
Strategy Risks
- Sideways Market Risk: May generate frequent false signals in ranging markets, consider adding oscillator filters
- Slippage Risk: Volume conditions may lead to execution slippage, requires volume threshold adjustment
- Money Management Risk: Fixed percentage stops may lack flexibility, consider dynamic adjustment based on volatility
- Trend Dependency: Strategy performs well in clear trends but may face consecutive losses during trend transitions
- Parameter Sensitivity: Multiple parameter combinations increase overfitting risk, requires backtesting across timeframes
Optimization Directions
- Dynamic Stop-Loss: Implement ATR indicator for dynamic stop-loss adjustment and improved market volatility adaptation
- Trend Strength Quantification: Add ADX or similar indicators to adjust position sizing based on trend strength
- Enhanced Volume Analysis: Include volume moving averages and abnormal volume analysis
- Entry Timing Optimization: Incorporate RSI or similar oscillators for overbought/oversold opportunities in trend direction
- Position Management: Implement dynamic position sizing based on trend strength and market volatility
Summary
This is a well-designed multi-level trend following strategy that builds a comprehensive analysis framework using classic technical analysis tools. Its strengths lie in the rigorous signal confirmation and complete risk management, while attention needs to be paid to performance in ranging markets. Through the suggested optimizations, particularly in dynamic risk management and trend strength quantification, the strategy's stability and profitability can be further enhanced.
- 1