Dynamic Multi-Period Quantitative Trading Strategy Combining RSI and EMA

Overview
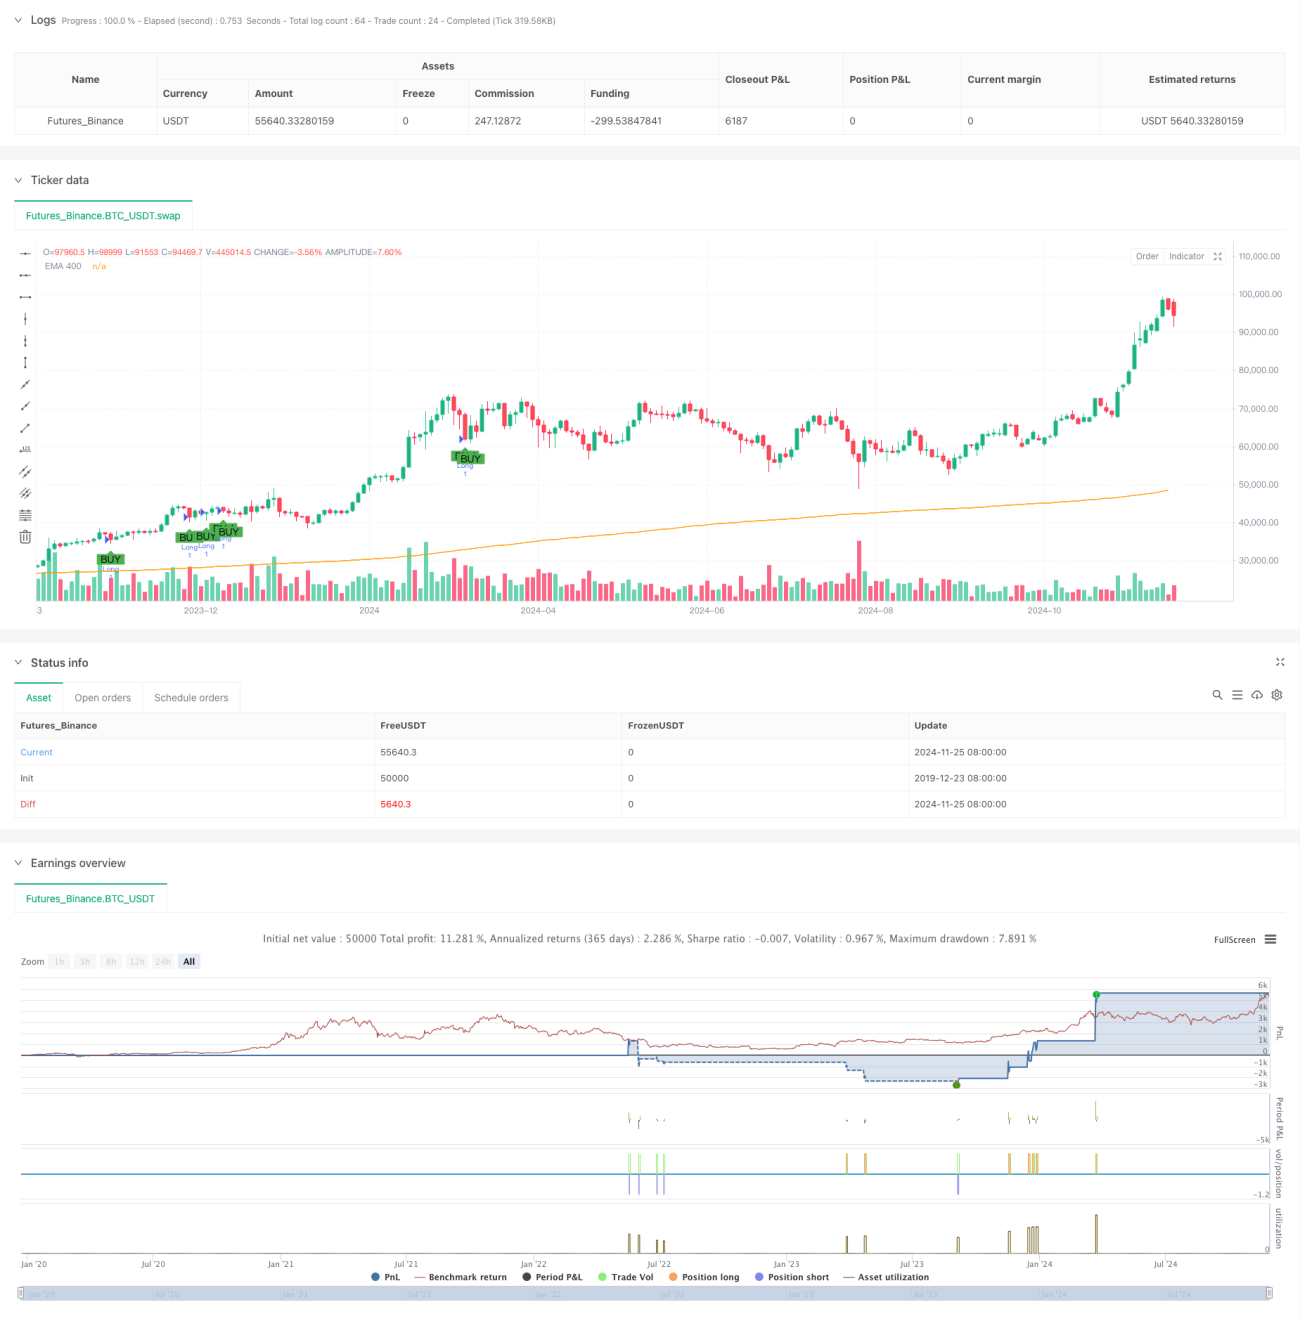
This strategy is a quantitative trading system based on RSI indicator and EMA line, combining Relative Strength Index (RSI) overbought/oversold signals with trend confirmation from Exponential Moving Average (EMA). The strategy includes a risk management module that controls risk through Stop-Loss and Take-Profit settings. According to backtest data, about 70% of trading instruments achieved profitability when tested on 15-minute timeframes.
Strategy Principles
The core logic of the strategy is based on the following key elements:
- RSI crossing signals: Short signals are triggered when RSI crosses down from overbought zone, while long signals are triggered when crossing up from oversold zone
- EMA trend confirmation: Using 400-period EMA as trend filter, only allowing long positions above EMA and short positions below EMA
- Risk control: Setting 1% stop-loss and take-profit levels for each trade for precise risk control
- Signal visualization: Clearly displaying buy/sell signals through shape markers on the chart
Strategy Advantages
- Multiple signal confirmation: Combining RSI and EMA indicators effectively reduces false signals
- Flexible parameter settings: Users can adjust RSI period, overbought/oversold thresholds, and EMA period based on different market conditions
- Complete risk management: Protects capital safety through stop-loss and take-profit mechanisms
- Visualized trading signals: Intuitive graphical interface aids strategy monitoring and verification
- High adaptability: Shows good profitability across multiple trading instruments
Strategy Risks
- Sideways market risk: May generate frequent false signals in ranging markets
- Slippage risk: Actual execution prices may deviate from signal prices in markets with insufficient liquidity
- Trend reversal risk: Fixed stop-loss levels may not be sufficient to avoid large price swings during strong trend reversals
- Parameter sensitivity: Different parameter combinations may lead to significant variations in strategy performance
Strategy Optimization Directions
- Dynamic stop-loss: Consider adjusting stop-loss positions dynamically based on market volatility
- Multi-timeframe analysis: Add signal confirmation mechanisms across multiple timeframes
- Volatility filtering: Introduce ATR indicator to filter trading signals in low volatility environments
- Position management: Add risk-based position management system
- Market environment recognition: Add market condition judgment module to use different parameter settings under different market conditions
Summary
This is a well-structured quantitative trading strategy with clear logic, achieving reliable trading signal generation through the combination of RSI and EMA. The strategy's risk management mechanism and parameter flexibility make it highly practical. Although there are some potential risks, the suggested optimization directions can further enhance the strategy's stability and profitability. It is suitable as a foundation framework for medium to long-term quantitative trading systems, and better trading results can be achieved through continuous optimization and adjustment.
- 1