Multi-Zone SMC Theory Based Intelligent Trend Following Strategy

Overview
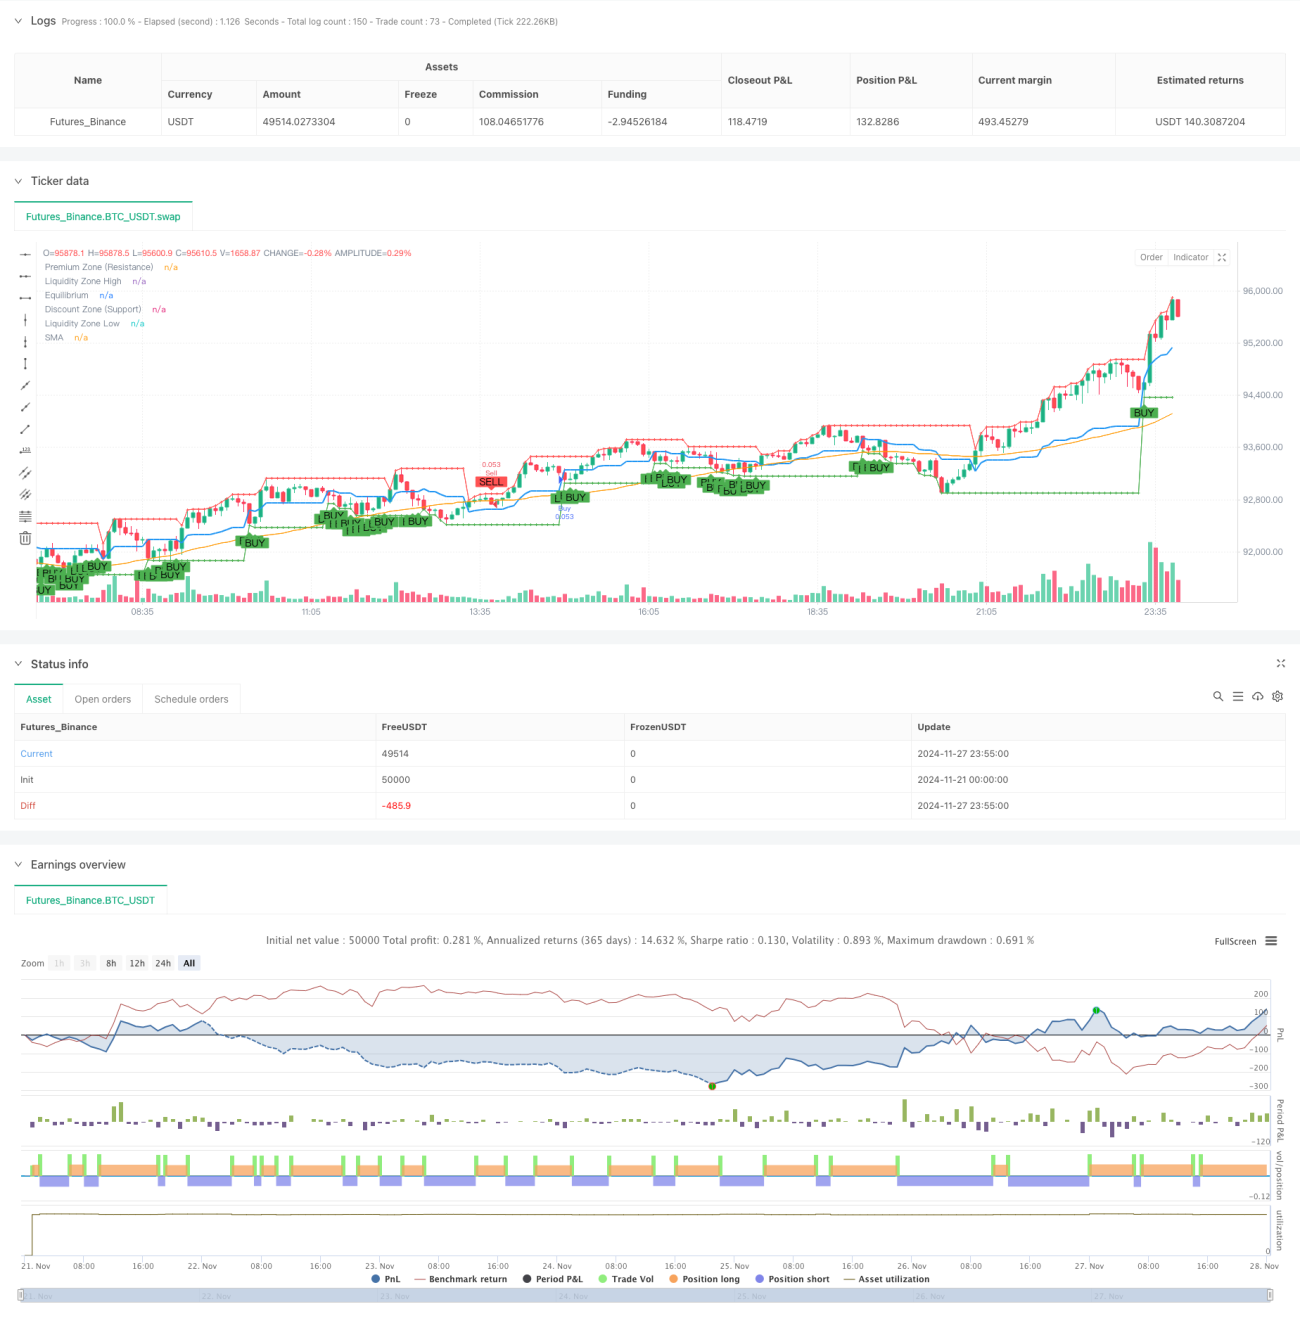
This strategy, based on Smart Money Concepts (SMC) theory, constructs a comprehensive trend following trading system by dividing the market into three key price zones: Equilibrium, Premium, and Discount. It combines a 50-period Simple Moving Average (SMA) with Order Block analysis to identify trading opportunities through price movements between different zones.
Strategy Principles
The core logic includes several key elements:
- Calculates swing highs and lows from the last 8 candles to determine market range.
- Defines the equilibrium zone as the midpoint between swing high and low, with premium zone above and discount zone below.
- Uses 50-period SMA to determine overall trend direction - bullish above SMA, bearish below.
- Generates buy signals in discount zone when price is above SMA, and sell signals in premium zone when price is below SMA.
- Identifies order blocks by analyzing highest and lowest prices within 20 candles to confirm trading signals.
- Marks swing highs and lows as liquidity zones to predict potential price reversal points.
Strategy Advantages
- Structured zone division method providing clear market phase identification.
- Multiple signal confirmation mechanism through triple verification of zones, trends, and order blocks.
- Dynamic adaptation to market changes with real-time key price level updates.
- Comprehensive risk management system including stop-loss and position management.
- Clean and efficient code implementation, easy to maintain and optimize.
Strategy Risks
- Potential false breakout signals in volatile markets.
- Indicator lag in rapid market reversals due to historical data dependence.
- Fixed-period moving average may not suit all market environments.
- Requires proper stop-loss settings for risk control.
Recommended risk management measures:
- Dynamic parameter adjustment for different market conditions
- Addition of volatility filters
- Implementation of strict money management rules
- Regular backtesting and parameter optimization
Optimization Directions
- Introduce adaptive parameters:
- Dynamically adjust zone ranges based on market volatility
- Implement adaptive-period moving averages
- Enhanced signal filtering:
- Add volume confirmation mechanism
- Incorporate momentum indicators
- Improve risk management:
- Implement dynamic stop-loss mechanism
- Optimize position sizing algorithm
- Increase execution efficiency:
- Optimize calculation logic to reduce resource consumption
- Improve signal generation mechanism for faster response
Summary
This strategy builds a robust trend following system through intelligent zone division and multiple signal confirmation mechanisms. Its core strengths lie in clear market structure analysis and comprehensive risk management. Through continuous optimization and improvement, the strategy shows promise for stable performance across different market conditions. Traders are advised to adjust parameters based on specific market characteristics and maintain strict risk control when implementing the strategy in live trading.
/*backtest
start: 2024-11-21 00:00:00
end: 2024-11-28 00:00:00
period: 5m
basePeriod: 5m
exchanges: [{"eid":"Futures_Binance","currency":"BTC_USDT"}]
*/

//@version=5
//@version=5
strategy("SMC Strategy with Premium, Equilibrium, and Discount Zones", overlay=true, default_qty_type=strategy.percent_of_equity, default_qty_value=10)
- 1