
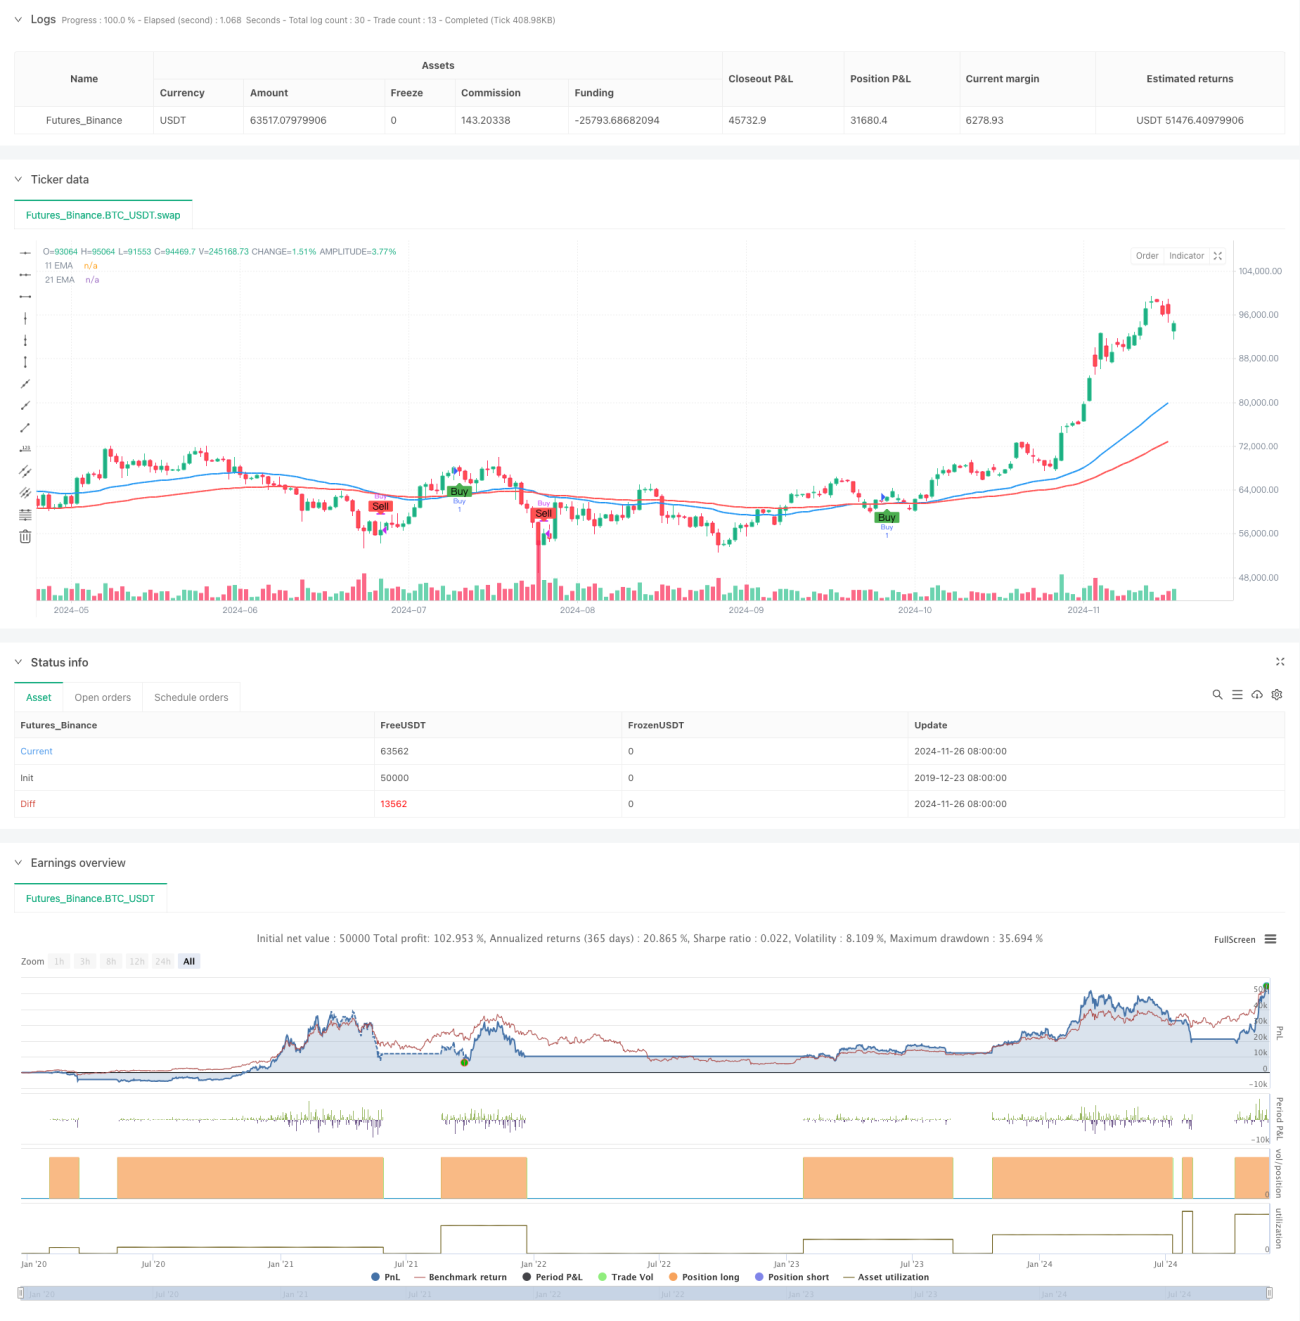
Overview
This is a quantitative trading strategy based on dual EMA crossover and trend following. The strategy primarily utilizes 47-period and 95-period Exponential Moving Averages (EMA) to capture market trends, executing trades based on EMA crossover signals. Operating on a 15-minute timeframe, it combines technical analysis and momentum trading principles to achieve consistent trading returns.
Strategy Principles
The core mechanism relies on identifying trend changes through crossovers between short-term EMA (47-period) and long-term EMA (95-period). Buy signals are generated when the short-term EMA crosses above the long-term EMA, while positions are closed when the short-term EMA crosses below. This design is based on price momentum and trend continuation principles, using EMA crossovers to confirm trend transition points.
Strategy Advantages
- Clear Signals: Dual EMA crossovers provide explicit entry and exit signals, reducing uncertainty from subjective judgment.
- Trend Following: The strategy effectively captures medium to short-term trends, generating profits during trend continuation.
- High Automation: Simple and clear strategy logic enables easy programming implementation and backtesting.
- Strong Adaptability: Strategy can be adapted to different market environments by adjusting EMA periods.
- Controlled Risk: Systematic trading rules help control emotional fluctuations and maintain trading discipline.
Strategy Risks
- Poor Performance in Ranging Markets: Frequent false breakouts in sideways markets may lead to consecutive losses.
- Lag Effect: EMA indicators have inherent lag, potentially missing optimal entry points or experiencing larger drawdowns during trend reversals.
- Parameter Dependency: Strategy performance heavily relies on EMA period selection, requiring different parameters for different markets.
- Capital Management: Lack of comprehensive stop-loss mechanisms may result in significant losses during volatile periods.
Optimization Directions
- Incorporate Volatility Indicators: Add ATR indicator for dynamic stop-loss adjustment to enhance risk control.
- Add Trend Filters: Combine RSI or MACD indicators to screen for more reliable trading signals.
- Optimize Parameter Selection: Implement machine learning methods for automatic selection of optimal EMA periods in different market environments.
- Improve Capital Management: Enhance position sizing and risk control modules, set maximum loss percentage per trade.
- Include Market Environment Analysis: Introduce market structure analysis to reduce trading frequency or pause trading during ranging markets.
Conclusion
This is a well-structured and logically rigorous trend-following strategy. It captures market trends through dual EMA crossovers, offering good operability and scalability. While certain limitations exist, continuous optimization and improvement can develop it into a stable and reliable trading system. The key is to flexibly adjust parameters based on different market characteristics and establish comprehensive risk control mechanisms.
- 1