
Overview
This strategy is a trading system based on Bollinger Bands and candlestick pattern analysis, designed to capture market reversals by analyzing price volatility and candlestick characteristics on the daily timeframe. The core methodology combines Bollinger Bands' volatility channels with the ratio relationship between candlestick shadows and bodies, looking for potential reversal signals when price touches the Bollinger Band boundaries. The system supports multi-timeframe analysis, allowing traders to execute trades on smaller timeframes while maintaining daily-level analysis.
Strategy Principles
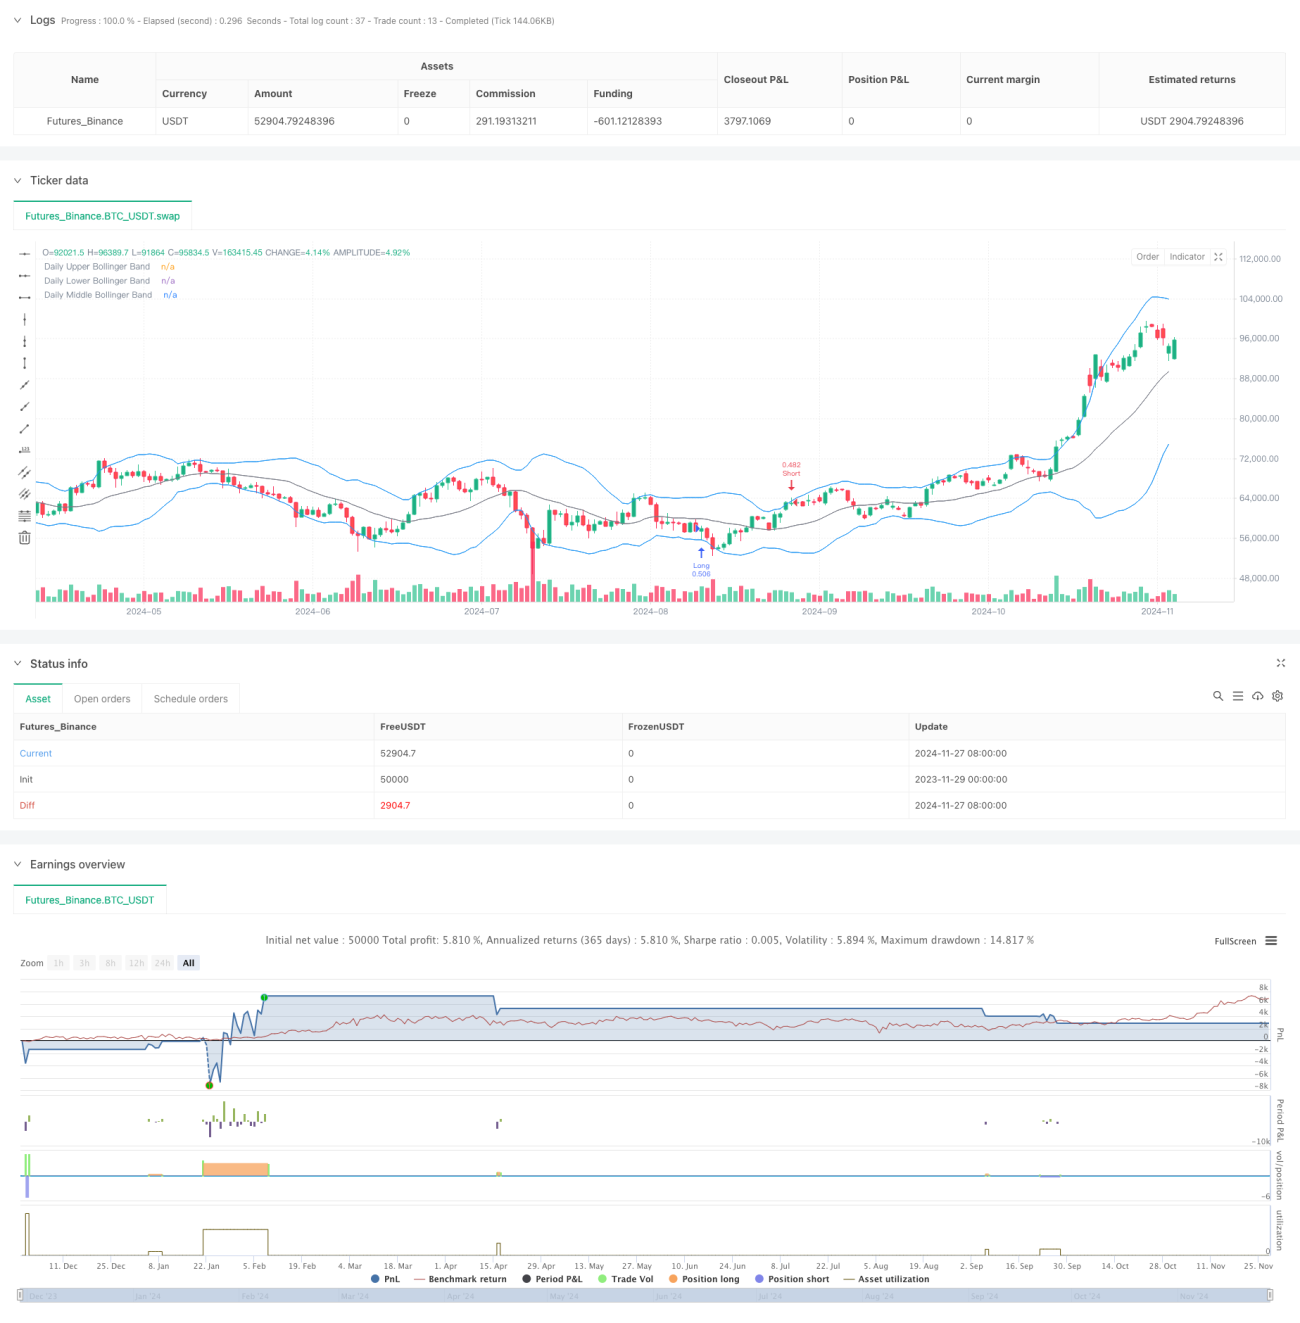
The strategy employs 20-period Bollinger Bands as the primary technical indicator with a standard deviation multiplier of 2.0. By calculating the ratio between candlestick shadows and bodies, the system generates trading signals when this ratio exceeds a set threshold (default 1.0) and price touches the Bollinger Band boundaries. Entry timing can be flexibly chosen at daily close, next day's open, daily high, or low. The strategy includes a risk management system based on account balance, controlling risk through dynamic position sizing. Stop-loss is set at recent swing highs or lows, with take-profit targets at the opposite Bollinger Band.
Strategy Advantages
- Multi-dimensional Analysis: Combines technical indicators and price pattern analysis for improved signal reliability.
- Flexible Entry Mechanism: Offers multiple entry timing options to suit different trading styles.
- Comprehensive Risk Management: Controls risk through dynamic position sizing and automated stop-loss.
- Multi-timeframe Compatibility: Enables trading on smaller timeframes while maintaining daily analysis.
- High Automation Level: Automates everything from signal identification to position management.
Strategy Risks
- Market Volatility Risk: May generate false signals in highly volatile markets.
- Lag Risk: Daily data usage might result in delayed responses in fast-moving markets.
- Parameter Sensitivity: Strategy performance significantly depends on Bollinger Band parameters and shadow ratio threshold choices.
- Liquidity Risk: May face execution challenges in less liquid markets.
Strategy Optimization Directions
- Incorporate Volume Analysis: Integrate volume data to validate price reversals.
- Add Market Environment Filters: Include trend strength indicators to filter unfavorable market conditions.
- Optimize Parameter Adaptation: Dynamically adjust Bollinger Band parameters and shadow ratio thresholds based on market volatility.
- Enhance Risk Control: Add drawdown control and equity curve monitoring mechanisms.
- Strengthen Signal Confirmation: Introduce additional technical indicators as confirmation tools.
Summary
This is a comprehensive trading system combining Bollinger Bands and candlestick analysis to capture market reversal opportunities. The strategy's strengths lie in its comprehensive analytical framework and robust risk management system, while attention must be paid to market conditions and parameter selection impacts. Through the suggested optimization directions, the strategy's stability and reliability can be further enhanced. For live trading implementation, thorough backtesting and parameter optimization are recommended, with adjustments made according to specific trading instrument characteristics.
/*backtest
start: 2023-11-29 00:00:00
end: 2024-11-28 00:00:00
period: 1d
basePeriod: 1d
exchanges: [{"eid":"Futures_Binance","currency":"BTC_USDT"}]
*/

//@version=5
strategy("Trade Entry Detector, based on Wick to Body Ratio when price tests Bollinger Bands", overlay=true, default_qty_type=strategy.fixed)

// Input for primary analysis time frame- 1