MACD-RSI Dynamic Crossover Quantitative Trading System

Overview
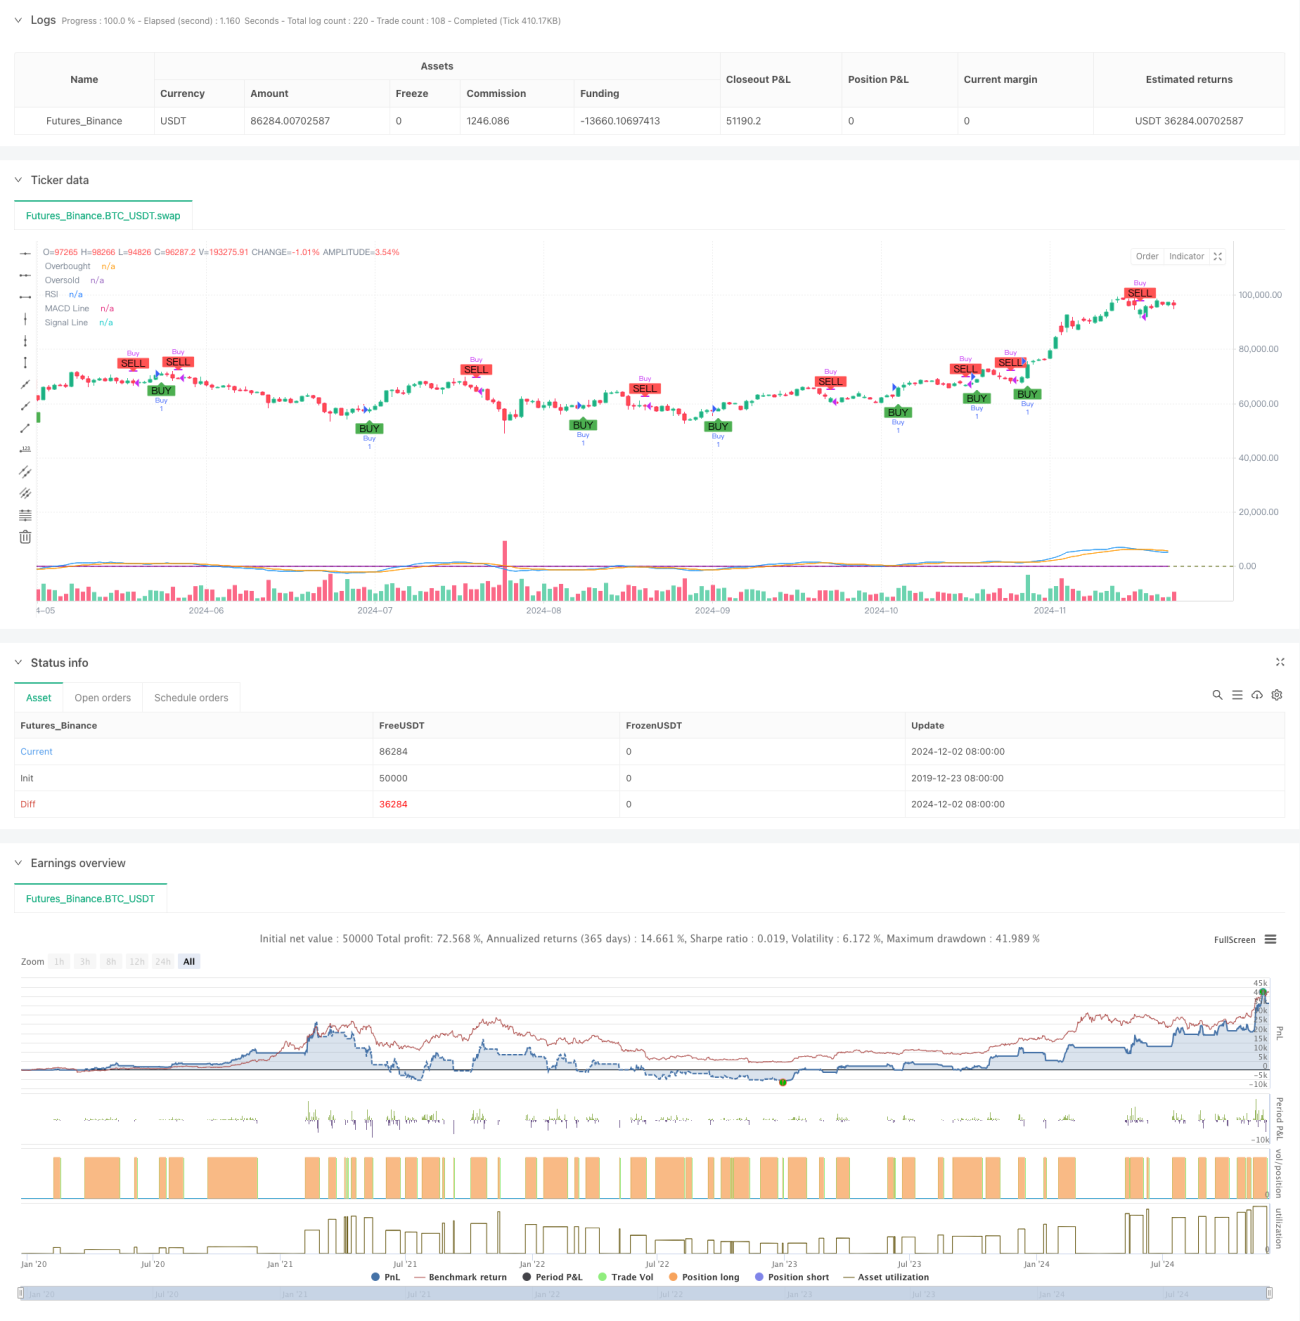
This strategy is a quantitative trading system that combines the Moving Average Convergence Divergence (MACD) and Relative Strength Index (RSI) indicators. The strategy identifies market trend reversal points by analyzing the crossover signals of these two technical indicators and overbought/oversold levels to make trading decisions. The system executes trades programmatically, automatically capturing market opportunities.
Strategy Principles
The core logic is based on two main technical indicators: MACD and RSI. The MACD indicator calculates the difference between fast (12-period) and slow (26-period) moving averages, comparing it with a signal line (9-period moving average) to determine trend direction. The RSI indicator calculates the relative strength over 14 periods to determine if the market is overbought or oversold.
Buy signals are generated when the MACD line crosses above the signal line and RSI is below 70 (overbought level). Sell signals are generated when the MACD line crosses below the signal line and RSI is above 30 (oversold level). This dual confirmation mechanism effectively filters out false signals.
Strategy Advantages
- High Signal Reliability: Combining MACD and RSI crossover confirmation significantly reduces the impact of false signals.
- Strong Parameter Adaptability: The strategy allows flexible adjustment of MACD and RSI parameters to adapt to different market conditions.
- High Automation Level: Fully programmatic strategy execution reduces emotional interference.
- Good Visualization: Clear buy/sell signals marked on charts facilitate analysis and backtesting.
- Comprehensive Risk Control: RSI overbought/oversold levels provide additional risk control measures.
Strategy Risks
- Choppy Market Risk: May generate frequent trading signals in sideways markets, increasing transaction costs.
- Lag Risk: Signal generation has inherent delay due to moving average calculations, potentially missing optimal entry points.
- Parameter Sensitivity: Optimal parameters may vary in different market environments, requiring periodic adjustment.
- False Breakout Risk: False breakthrough signals may occur during increased market volatility.
Optimization Directions
- Incorporate Volatility Indicators: Consider adding ATR or volatility indicators for dynamic parameter adjustment.
- Enhance Signal Confirmation: Add volume or other technical indicators as additional confirmation conditions.
- Add Trend Filters: Introduce longer-period moving averages as trend filters.
- Improve Stop Loss Mechanism: Design more flexible stop-loss strategies, such as trailing stops or time-based exits.
- Optimize Position Management: Dynamically adjust position sizes based on signal strength and market conditions.
Summary
The MACD-RSI Dynamic Crossover Quantitative Trading System is an automated trading strategy combining classic technical analysis indicators. Through the dual mechanism of MACD trend judgment and RSI overbought/oversold confirmation, it effectively captures market turning points. The strategy offers high reliability and strong adaptability, but traders must be mindful of choppy market and signal lag risks. There is significant room for improvement through the introduction of additional technical indicators and signal confirmation optimization. In practical application, investors should adjust parameters based on specific market conditions and combine with other analysis methods.
- 1