
Overview
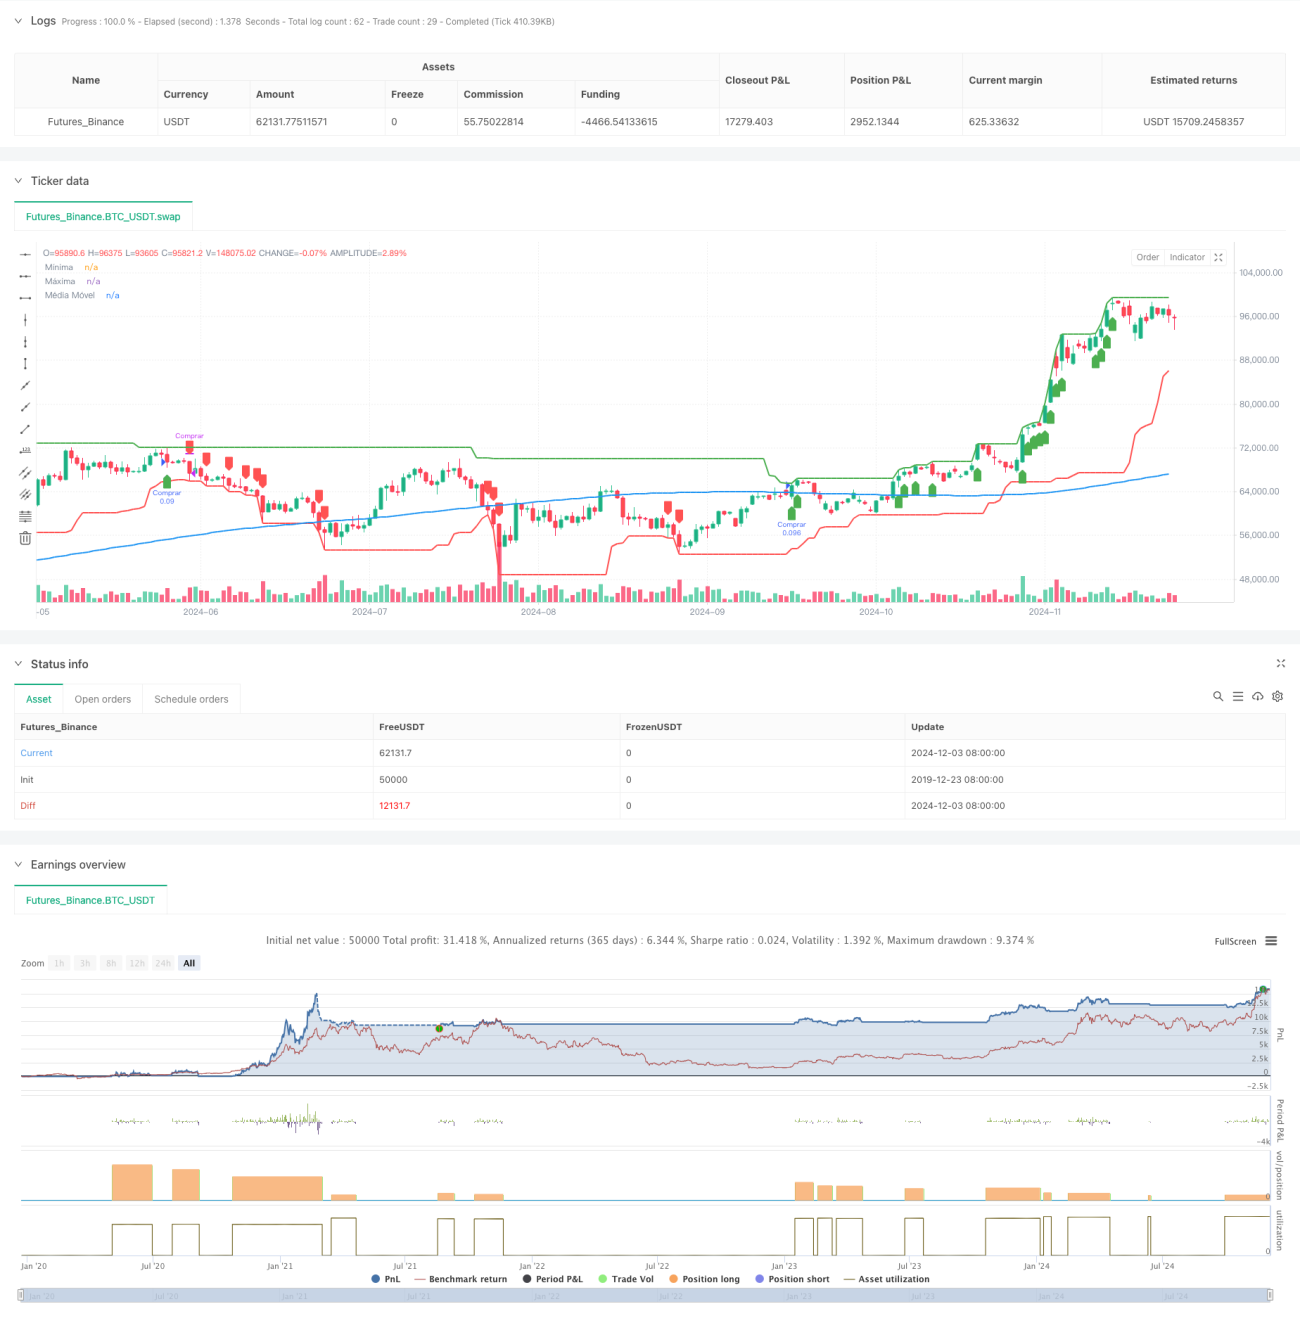
This strategy is a trend following system based on historical price breakouts and moving average filters. It combines multi-period price breakout signals with moving averages to identify market trends, using strict entry and exit rules to capture medium to long-term market movements. The strategy uses 55-day price breakouts for long signals, 20-day price breakouts for exits, and incorporates a 200-day moving average as a trend filter to effectively reduce false breakout risks.
Strategy Principles
The core logic is built on price breakouts and trend following. Specifically:
- Entry Signal: System generates a long signal when price makes a 55-day high and closes above the 200-day moving average
- Exit Signal: System closes positions when price breaks below the 20-day low
- Trend Filter: Uses 200-day moving average as major trend indicator, only entering longs above the average
- Position Management: Uses 10% of account equity for each trade
- Moving Average Options: Supports SMA, EMA, WMA, VWMA, allowing flexibility based on market characteristics
Strategy Advantages
- Clear Logic: Strategy uses classic price breakout and moving average indicators, easy to understand and execute
- Robust Risk Control: Has clear stop-loss conditions, manages risk through moving average filters and position control
- High Adaptability: Can be adjusted through parameters to suit different market environments
- Strong Trend Capturing: Uses multiple timeframe price breakouts to confirm trend direction
- High Automation: Clear strategy rules facilitate programmatic implementation
Strategy Risks
- Choppy Market Risk: Prone to false breakouts during consolidation phases
- Slippage Risk: May experience significant slippage in less liquid markets
- Trend Reversal Risk: Potential for large drawdowns near major trend turning points
- Parameter Sensitivity: Optimal parameters may vary significantly across different market environments
- Money Management Risk: Fixed proportion positioning may be too risky in certain situations
Optimization Directions
- Signal Confirmation: Can add volume breakout and other auxiliary indicators to filter false breakouts
- Dynamic Stop Loss: Incorporate ATR and other volatility indicators for dynamic stop loss
- Position Management: Dynamically adjust position size based on market volatility
- Multi-timeframe Analysis: Add more timeframe analysis to improve signal reliability
- Market Environment Recognition: Add trend strength indicators to judge current market conditions
Summary
This is a strategic system that combines classic turtle trading rules with modern technical analysis tools. It captures trends through price breakouts, confirms direction using moving averages, and controls risk with reasonable position management. The strategy logic is clear, practical, and has good scalability. While it may underperform in choppy markets, through proper parameter optimization and risk control, it can still achieve stable returns in trending markets. Traders are advised to adjust parameters based on specific market characteristics and establish comprehensive money management systems when applying to live trading.
- 1