Triple Bollinger Bands Touch Trend Following Quantitative Trading Strategy

Overview
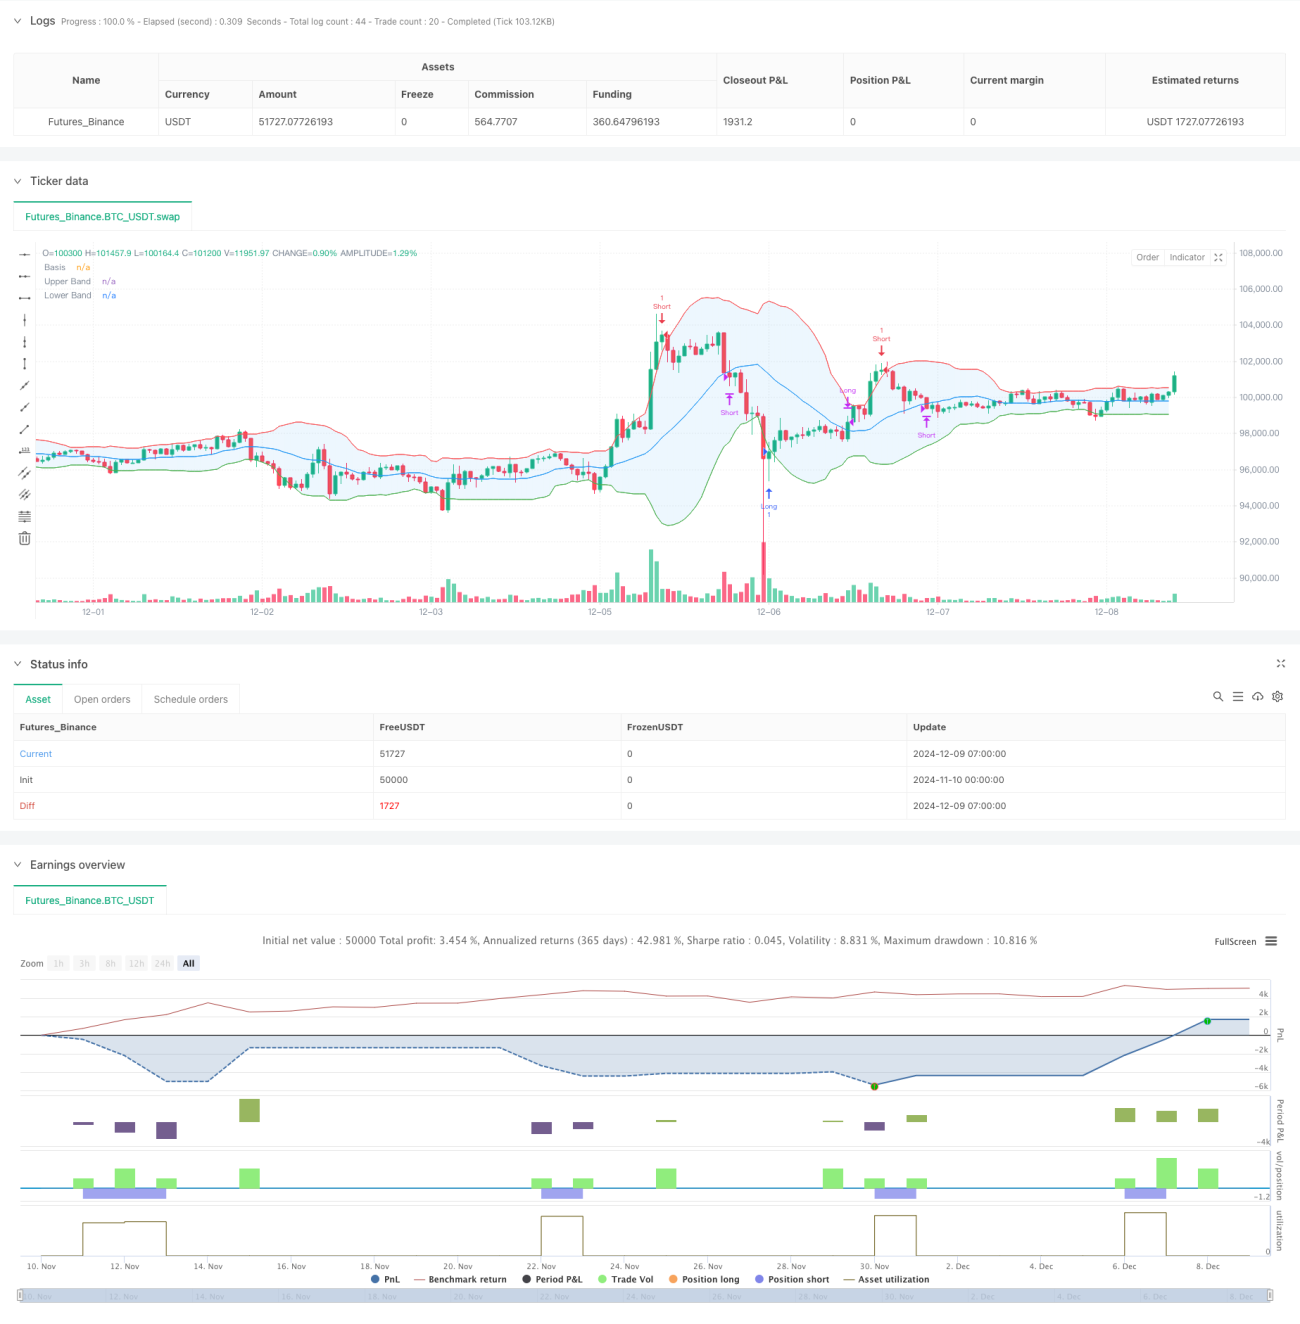
This strategy is an improved version of the traditional Bollinger Bands trend-following system. It monitors price action for three consecutive touches of the Bollinger Bands to confirm trend reliability, resulting in higher win rates. The strategy uses a 20-period moving average as the middle band and 2 standard deviations for the upper and lower bands. Through detailed analysis of price relationships with band boundaries, it achieves a trading system with unique advantages.
Strategy Principles
The core logic relies on a counting mechanism to identify sustained price touches of the Bollinger Band boundaries. The system generates a long signal when price breaks below the lower band three consecutive times, and a short signal when price breaks above the upper band three consecutive times. This mechanism effectively filters out false breakouts, improving trading reliability. The strategy uses the middle band (20-period moving average) as an exit signal, completing trades when price returns to the middle band. This design ensures both trend capture and timely profit-taking.
Strategy Advantages
- High Reliability: Requiring three consecutive touches of band boundaries to confirm trading signals significantly reduces the impact of false breakouts.
- Risk Control: Using the moving average as an exit point enables timely stop-loss when trends reverse.
- Strong Adaptability: Strategy parameters can be adjusted for different market conditions, offering good universality.
- Moderate Trading Frequency: Strict entry conditions prevent overtrading.
- Rational Money Management: Position sizing based on account equity percentage ensures controlled risk.
Strategy Risks
- Ranging Market Risk: May generate frequent false signals in sideways markets.
- Slippage Risk: Potential for significant slippage losses during volatile market conditions.
- Parameter Sensitivity: Strategy performance heavily depends on Bollinger Bands parameter settings.
- Trend Reversal Risk: May incur substantial losses during sudden trend reversals.
Strategy Optimization Directions
- Incorporate Volume Indicators: Combining volume analysis can improve signal reliability.
- Dynamic Parameter Adjustment: Adapt Bollinger Bands parameters based on market volatility.
- Add Trend Confirmation Indicators: Include additional technical indicators to confirm trend direction.
- Optimize Stop-Loss Mechanism: Design more flexible stop-loss approaches for different market environments.
- Enhance Position Management: Dynamically adjust position sizes based on signal strength.
Summary
This strategy improves upon traditional Bollinger Bands trading systems by implementing a highly reliable trend-following approach. Its unique triple-touch confirmation mechanism effectively increases win rates, while the moving average-based exit mechanism provides a rational profit-taking solution. Though inherent risks exist, the suggested optimization directions can further enhance strategy stability and profitability.
- 1