Volume-Weighted Dual Trend Detection System

Overview
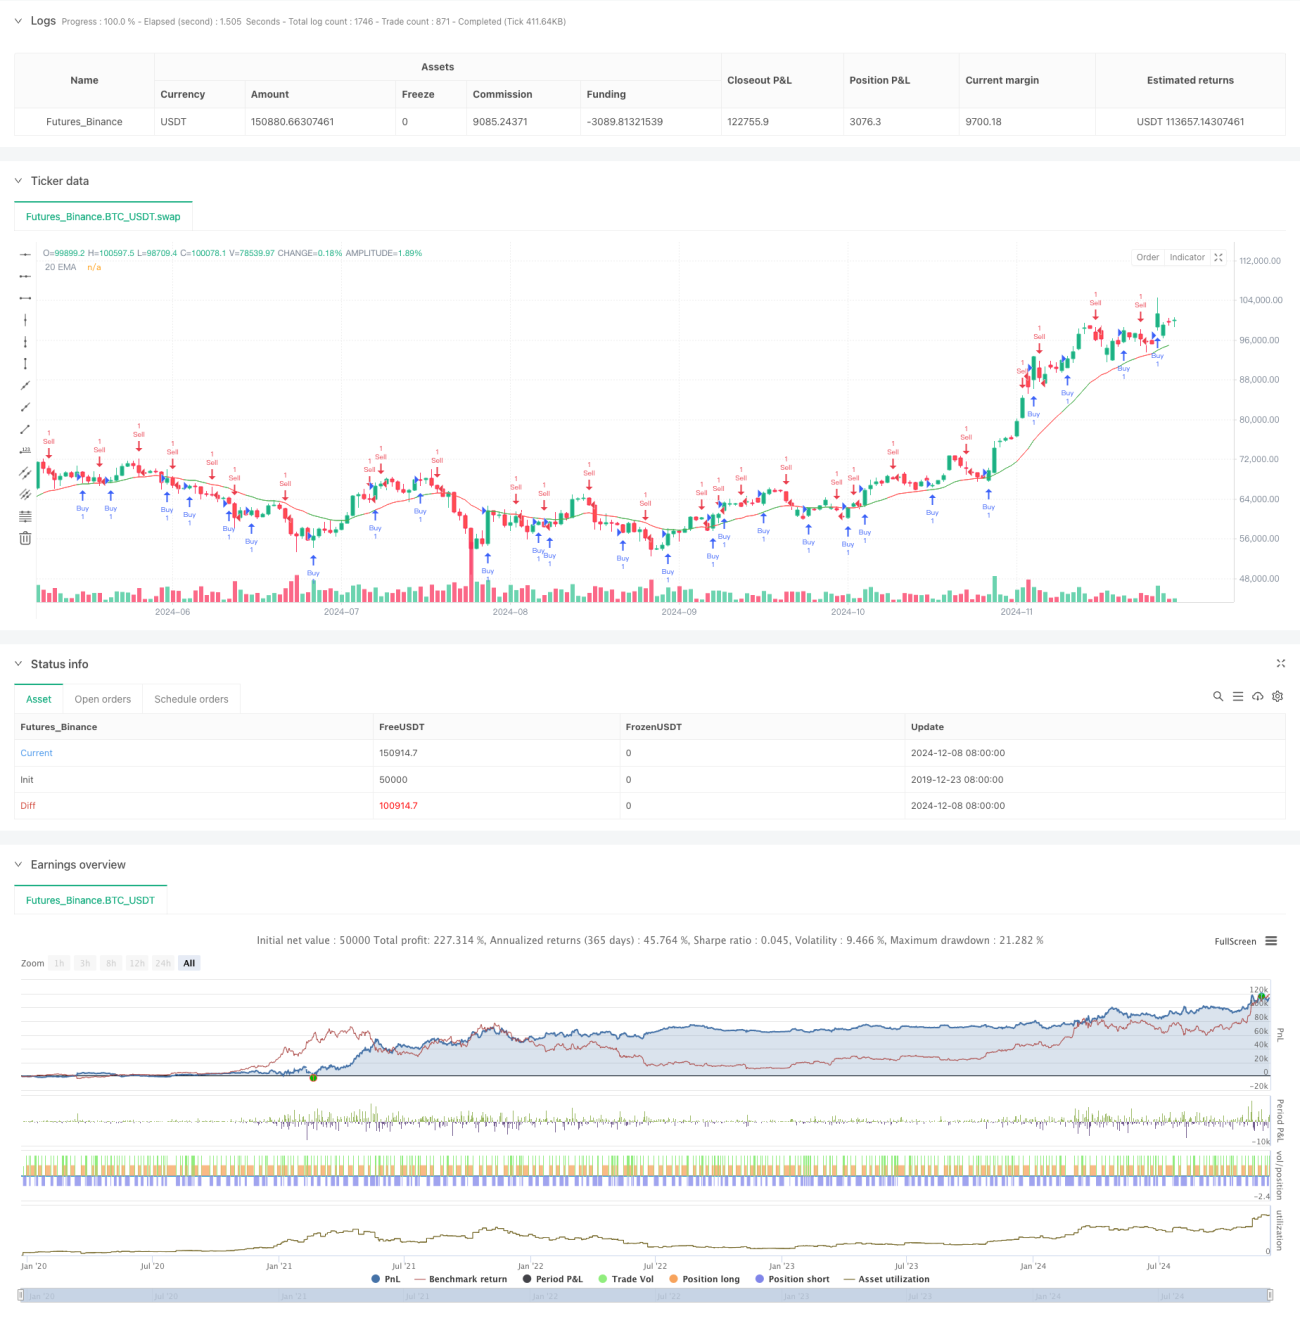
This is a trend detection system that combines trading volume weighting and price movement. The system calculates the difference between opening and closing prices (Delta value), weighted by trading volume, to form a unique trend indicator. The system also integrates a Simple Moving Average (SMA) for signal confirmation, determining market trends by comparing the Delta value with its SMA. Additionally, the system incorporates EMA as an auxiliary indicator, forming a multi-dimensional analytical framework.
Strategy Principles
- Delta Value Calculation: Uses the difference between opening and closing prices within a specific period, weighted by trading volume
- Signal Generation Mechanism:
- When Delta crosses above its SMA, the system identifies a bearish signal
- When Delta crosses below its SMA, the system identifies a bullish signal
- EMA Integration:
- System uses 20-period EMA for trend confirmation
- EMA color changes based on Delta value's position relative to its SMA
- Volume Filter: Sets volume threshold to ensure trading occurs under sufficient liquidity conditions
Strategy Advantages
- Multi-dimensional Analysis: Combines price, volume, and moving average systems for a more comprehensive market perspective
- Signal Reliability: Reduces random price fluctuation effects through volume weighting
- Strong Adaptability: Operates effectively across multiple timeframes, including 4-hour and daily
- Parameter Flexibility: Offers multiple adjustable parameters for optimization across different market characteristics
- Risk Control: Built-in volume filtering mechanism effectively avoids low liquidity environments
Strategy Risks
- Trend Reversal Risk: May generate false signals in volatile markets
- Parameter Sensitivity: Different parameter combinations may lead to significant strategy performance variations
- Time Lag Risk: Inherent lag in moving average systems may delay entry timing
- Market Environment Dependency: May generate frequent trading signals in sideways markets
Strategy Optimization Directions
- Introduce Dynamic Parameters:
- Automatically adjust Delta calculation period based on market volatility
- Dynamically adjust volume threshold based on volume changes
- Enhance Signal Filtering:
- Add trend strength confirmation indicators
- Integrate price pattern recognition systems
- Improve Risk Management:
- Establish dynamic stop-loss mechanism
- Introduce position management system
Summary
This is a systematic strategy that organically combines price momentum, trading volume, and trend indicators. Through multi-dimensional analysis and strict trading condition screening, the strategy maintains high reliability while demonstrating good adaptability and scalability. The core advantage lies in its three-dimensional judgment of market trends, while its greatest development potential lies in dynamic parameter optimization and risk management system improvement.
- 1