
Overview
This strategy is a trend-following trading system that combines multiple technical indicators. It integrates RSI (Relative Strength Index), MACD (Moving Average Convergence Divergence), and SMA (Simple Moving Average) to execute trades when market trends are clearly defined. The strategy also incorporates take profit, stop loss, and trailing stop mechanisms for better risk management.
Strategy Principles
The strategy executes trades based on the following core conditions:
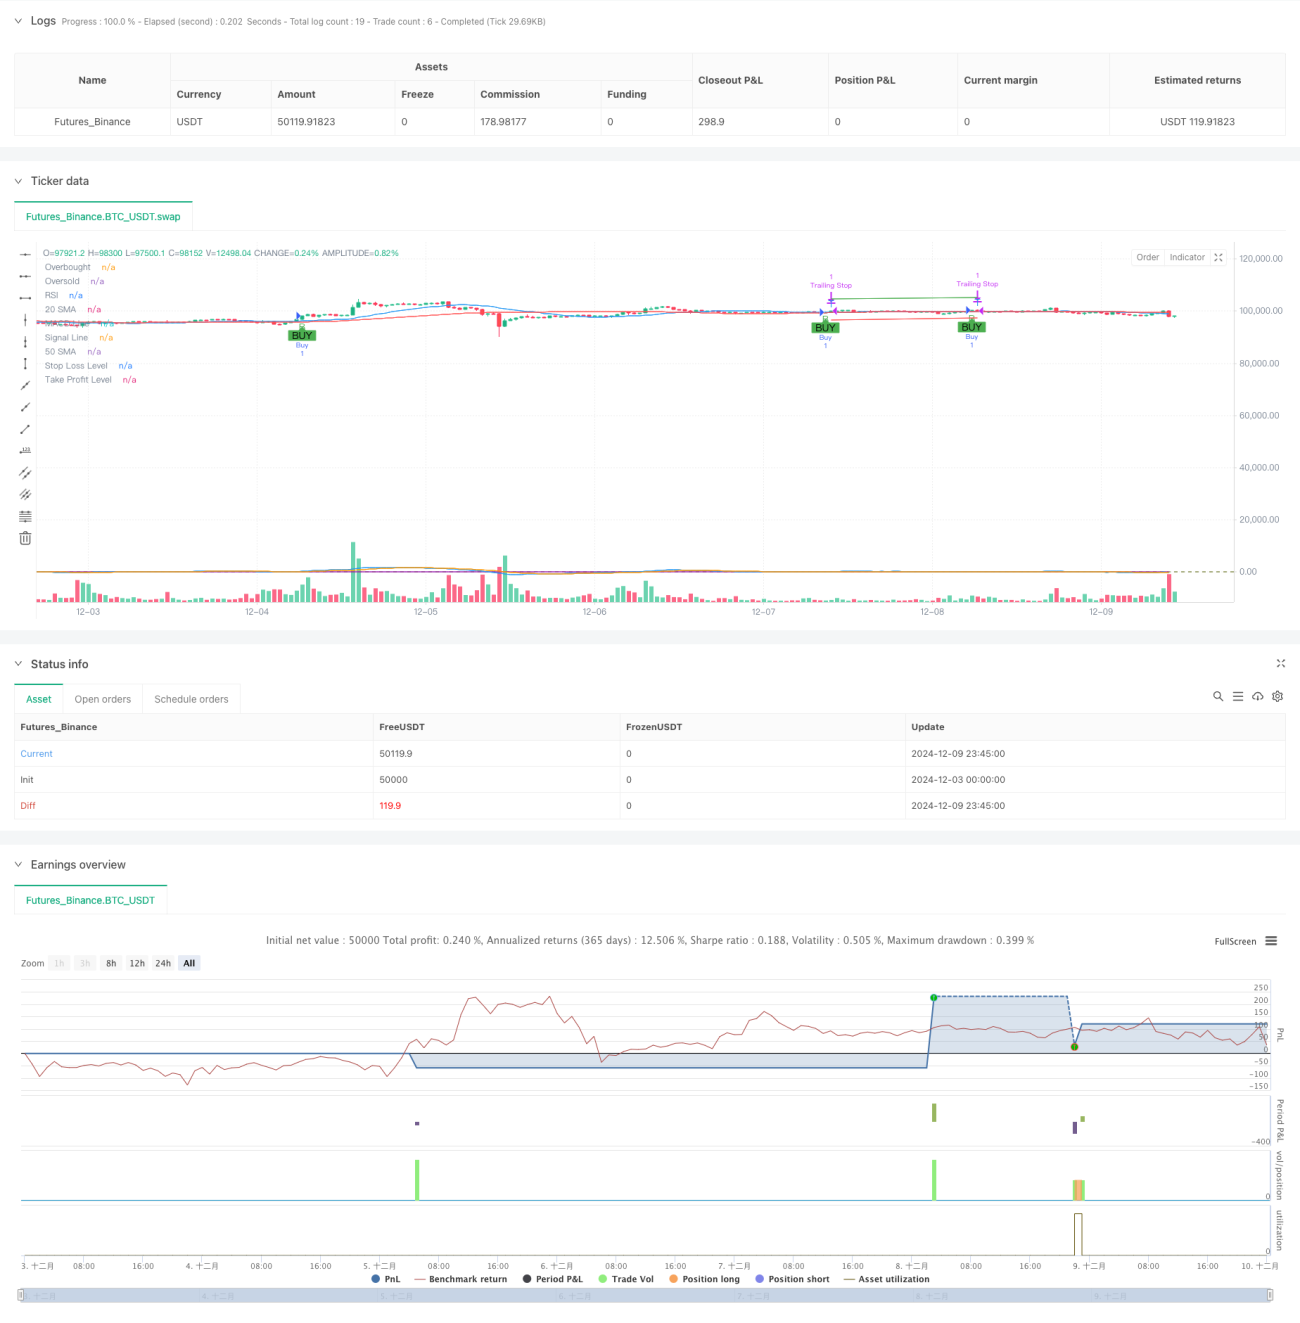
- MACD shows a golden cross (MACD line crosses above the signal line)
- RSI is below 70, avoiding overbought territories
- Price is above the short-term moving average (20-day SMA)
- Short-term moving average is above the long-term moving average (50-day SMA)
When all these conditions are met simultaneously, the system generates a long signal. Additionally, the strategy sets a 5% take profit target, 3% stop loss limit, and 2% trailing stop to protect accumulated profits. This multi-layered approach to trade conditions helps improve accuracy and security.
Strategy Advantages
- Integration of multiple technical indicators enhances signal reliability
- RSI filtering prevents entries in overbought areas
- Moving average system helps confirm medium to long-term trends
- Comprehensive risk management system including fixed and trailing stops
- Flexible parameter adjustment for different market conditions
- Customizable date range for backtesting and live trading
Strategy Risks
- Multiple indicators may lead to delayed signals
- False signals may occur in ranging markets
- Fixed take profit and stop loss levels may not suit all market conditions
- Trailing stops might exit profitable trades too early in volatile markets
Mitigation measures include: adjusting indicator parameters, adapting profit/loss ratios to market characteristics, and adding market environment filters.
Optimization Directions
- Incorporate volatility indicators (like ATR) for adaptive profit/loss levels
- Add volume indicators to validate signal strength
- Implement market condition analysis for parameter adaptation
- Optimize MACD parameters for more timely signals
- Consider adding reversal signals for short positions
These optimizations would enhance strategy adaptability and stability.
Summary
This strategy establishes a comprehensive trading system through the combination of multiple technical indicators. It encompasses both trend-following logic and risk management considerations. While there are areas for optimization, the overall framework provides good scalability and adaptability. Successful implementation requires traders to optimize parameters and improve the strategy based on actual market conditions.
- 1