Multi-Period Bollinger Bands Touch Trend Reversal Quantitative Trading Strategy

Overview
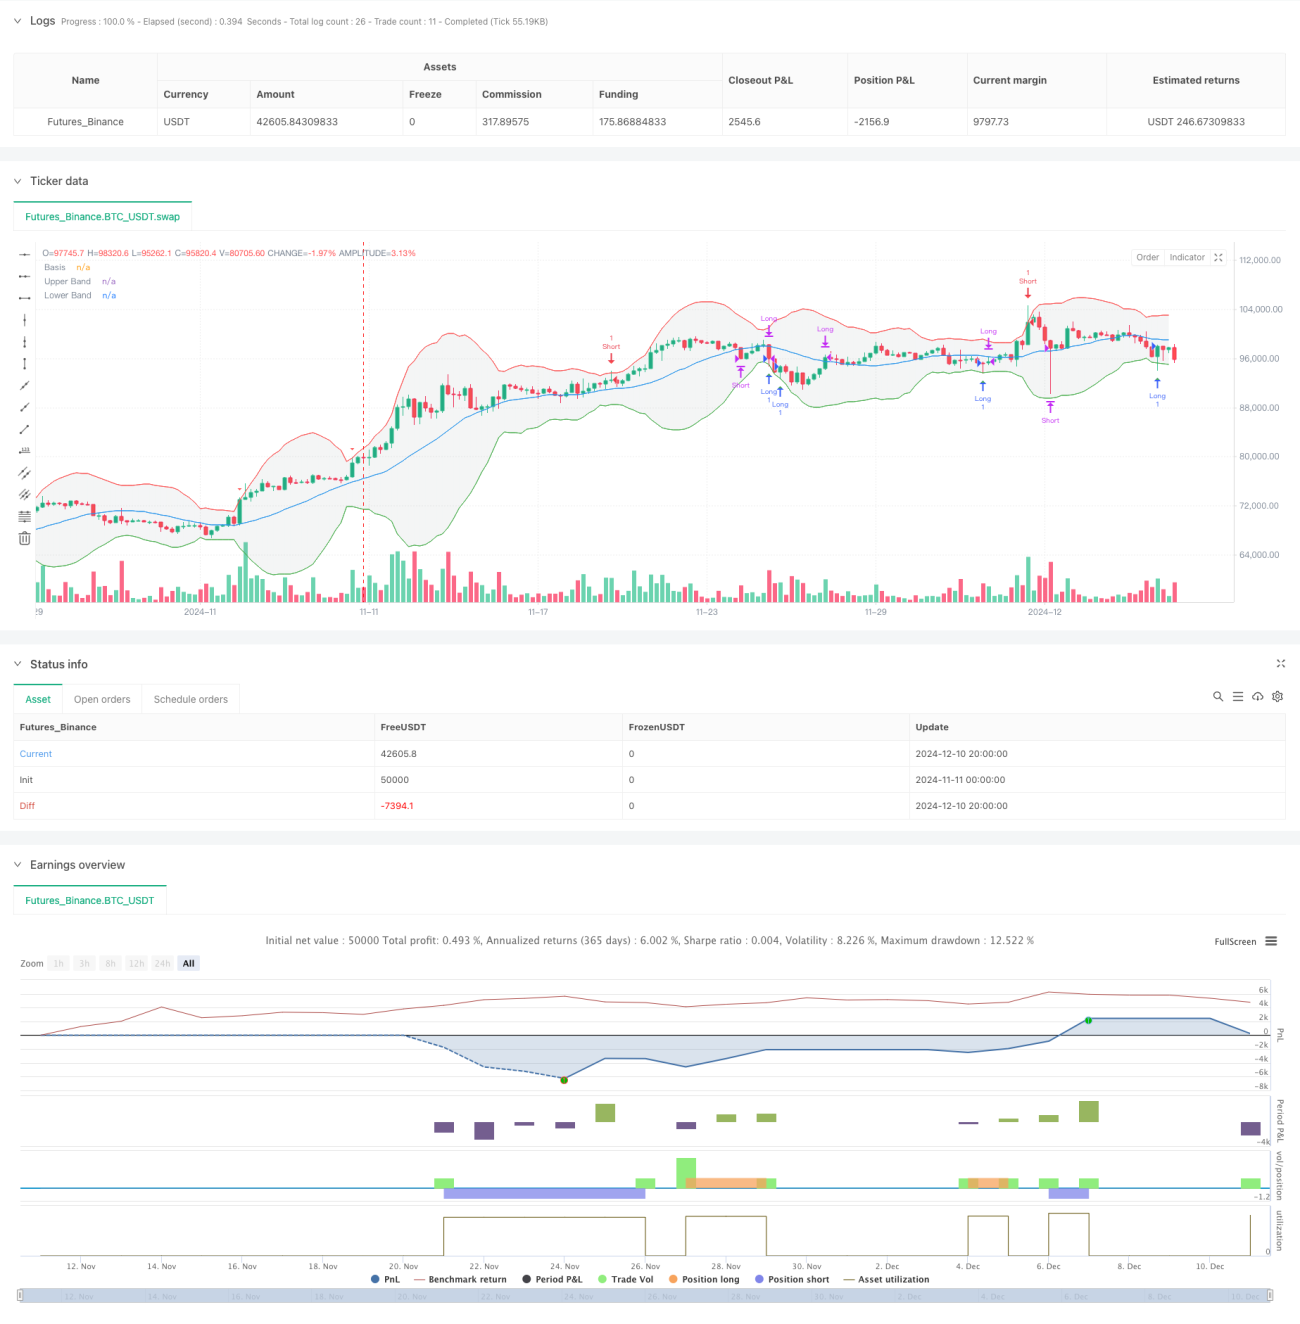
This strategy is a trend reversal trading system based on the Bollinger Bands indicator, which captures market reversal opportunities by monitoring the relationship between price and Bollinger Bands. The strategy operates on a 5-minute timeframe, using a 20-period moving average as the middle band and 3.4 standard deviations for the upper and lower bands. Trading signals are generated when prices touch the upper or lower bands.
Strategy Principle
The core logic is built on mean reversion theory. When price touches the lower band, the system considers the market oversold and tends to go long; when price touches the upper band, the system considers the market overbought and tends to go short. Specifically:
- Long condition: When the 5-minute candlestick's low first touches or breaks the lower band (current low <= lower band AND previous low > lower band)
- Short condition: When the 5-minute candlestick's high first touches or breaks the upper band (current high >= upper band AND previous high < upper band)
- Exit condition: Close positions when price reverts to the middle band
Strategy Advantages
- Rational indicator selection: Bollinger Bands integrate trend and volatility information for effective market state identification
- Precise entry timing: Captures reversal signals through first touch of bands, avoiding chasing trends
- Robust risk control: Uses moving average as profit-taking benchmark, protecting profits without premature exits
- Scientific parameter configuration: 3.4 standard deviation setting effectively filters false signals
- Clear system structure: Simple and intuitive trading logic, easy to maintain and optimize
Strategy Risks
- Trend breakthrough risk: In strong trend markets, continuous band breakouts may lead to frequent stops
- Range-bound market risk: May generate excessive false signals during consolidation periods
- Parameter sensitivity: Minor changes in Bollinger Bands parameters can significantly impact strategy performance
- Slippage impact: High volatility environments may face severe slippage affecting strategy performance
- Timeframe dependency: Strategy performance may vary significantly across different timeframes
Strategy Optimization Directions
- Multiple timeframes: Introduce longer period Bollinger Bands for confirmation to improve signal reliability
- Trend filtering: Add trend identification indicators to only trade in clear trend directions
- Dynamic parameters: Adapt Bollinger Bands parameters based on market volatility
- Stop-loss optimization: Implement trailing stops or ATR-based stops to improve risk control
- Position management: Dynamically adjust position sizes based on signal strength and market volatility
Summary
This strategy captures market reversal opportunities through Bollinger Bands touches, featuring clear logic and reasonable risk control. Through appropriate parameter settings and comprehensive trading rules, the strategy shows good stability in range-bound markets. However, when applying to live trading, attention must be paid to trend breakthrough risks. It is recommended to combine other technical indicators for trade confirmation and dynamically adjust strategy parameters based on market conditions. Optimization focuses mainly on multi-period coordination, trend filtering, and dynamic parameter adjustment.
- 1