Multi-Indicator Trend Following Strategy with Dynamic Channel and Moving Average Trading System

Overview
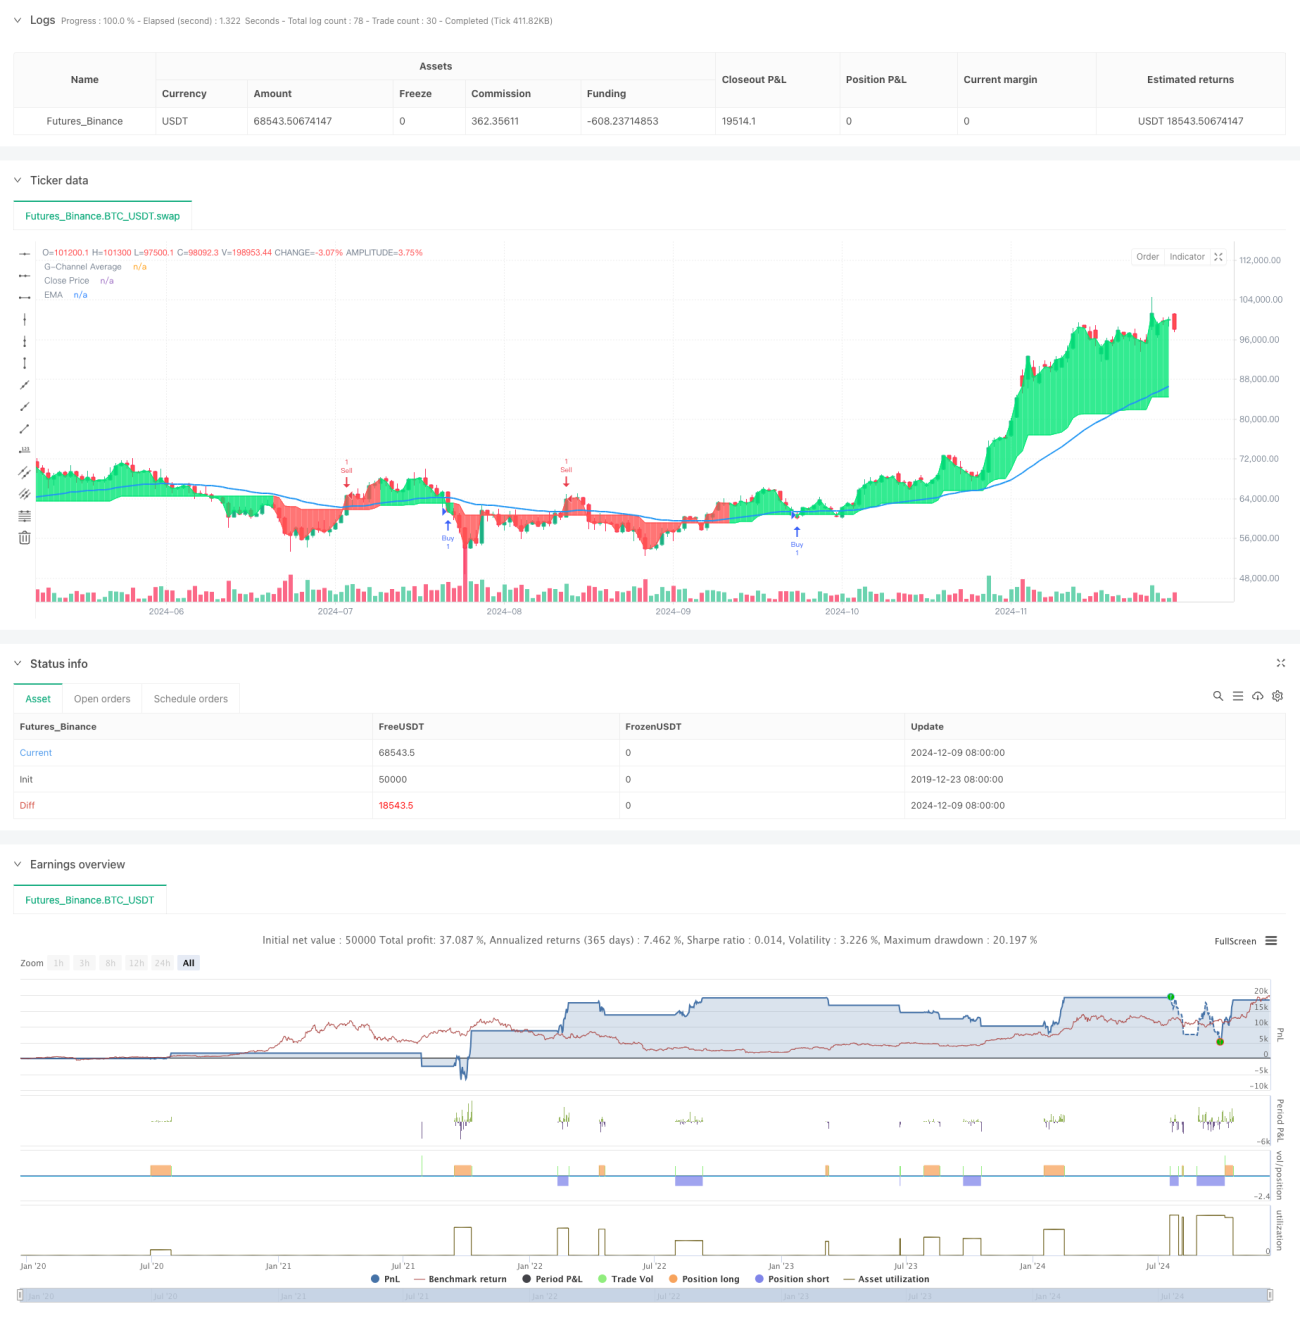
This strategy is a multi-indicator trading system that combines G-Channel, Exponential Moving Average (EMA), and Average True Range (ATR). It identifies trading signals through dynamic support/resistance levels and trend confirmation, while managing risk using ATR-based stop-loss and take-profit levels. The system emphasizes reliability and risk control, suitable for traders seeking a robust trading approach.
Strategy Principles
The core logic of the strategy is based on the following key components:
- G-Channel calculates dynamic support and resistance levels, continuously adjusting upper and lower bands
- EMA confirms overall trend direction, with trade direction determined by price position relative to EMA
- Entry signals are based on G-Channel breakouts and EMA position confirmation
- Stop-loss and take-profit levels are set using ATR multiples, with 2x ATR for stop-loss and 4x ATR for take-profit
- State tracking prevents consecutive duplicate signals
Strategy Advantages
- Multi-level signal confirmation mechanism improves trading reliability
- Dynamically adjusted channel boundaries adapt to different market conditions
- Volatility-based risk management provides better adaptability
- Avoiding duplicate signals reduces overtrading risk
- Clear visual buy/sell markers facilitate analysis and backtesting
Strategy Risks
- May generate excessive false breakout signals in ranging markets
- EMA as a lagging indicator can lead to delayed entry timing
- Fixed ATR multipliers for stops may lack flexibility during high volatility periods
- Requires longer historical data for indicator calculations
- Parameter optimization may lead to overfitting
Strategy Optimization Directions
- Incorporate volume confirmation for improved breakout reliability
- Implement dynamic ATR multipliers to adapt to different market volatility states
- Add market environment filters to avoid trading during unfavorable conditions
- Optimize signal filtering logic to further reduce false signals
- Consider adding a dynamic position sizing system
Summary
The strategy builds a complete trading system by combining multiple mature technical indicators. Its strength lies in the multi-level signal confirmation mechanism and volatility-based risk management, though it still requires optimization based on specific market characteristics in practical applications. Through the suggested optimization directions, the strategy's stability and adaptability can be further enhanced.
- 1