Overview
This strategy is a trading system based on multiple technical indicators, integrating CCI, RSI, Stochastic, and MFI indicators with exponential smoothing to build a comprehensive market analysis framework. The strategy uses IFT (Inverse Fisher Transform) to normalize indicator outputs and generates trading decisions through signal synthesis.
Strategy Principle
The core of the strategy is to provide more reliable trading signals through multi-indicator fusion. The process includes: 1. Calculate and normalize CCI, RSI, Stochastic, and MFI indicators 2. Apply WMA smoothing to indicator values 3. Transform values to a unified interval using IFT 4. Calculate the average of four transformed indicators as final signal 5. Generate long signals when crossing -0.5 and short signals when crossing 0.5 6. Set 0.5% stop-loss and 1% take-profit for risk control
Strategy Advantages
- Multi-indicator fusion provides comprehensive market perspective
- IFT transformation ensures consistency in indicator outputs
- WMA smoothing effectively reduces false signals
- Reasonable stop-loss and take-profit settings
- Clear signal generation mechanism for debugging and optimization
Strategy Risks
- Multiple indicators may lag in volatile markets
- Fixed stop-loss and take-profit parameters may not suit all market conditions
- WMA smoothing might cause signal delays
- Indicator parameters need optimization for different markets Suggestions: Implement dynamic risk management, introduce volatility indicators, optimize smoothing parameters
Optimization Directions
- Introduce adaptive stop-loss and take-profit mechanisms
- Add market environment filtering
- Optimize signal synthesis with weighted averaging
- Implement volume-weighted and volatility-adjusted mechanisms
- Develop automatic parameter optimization system
Summary
The strategy builds a relatively complete trading system through multi-indicator fusion and signal optimization. Its strengths lie in signal reliability and comprehensive risk control, but parameters still need optimization based on market characteristics. Through the suggested optimization directions, the strategy has the potential to perform better in various market environments.
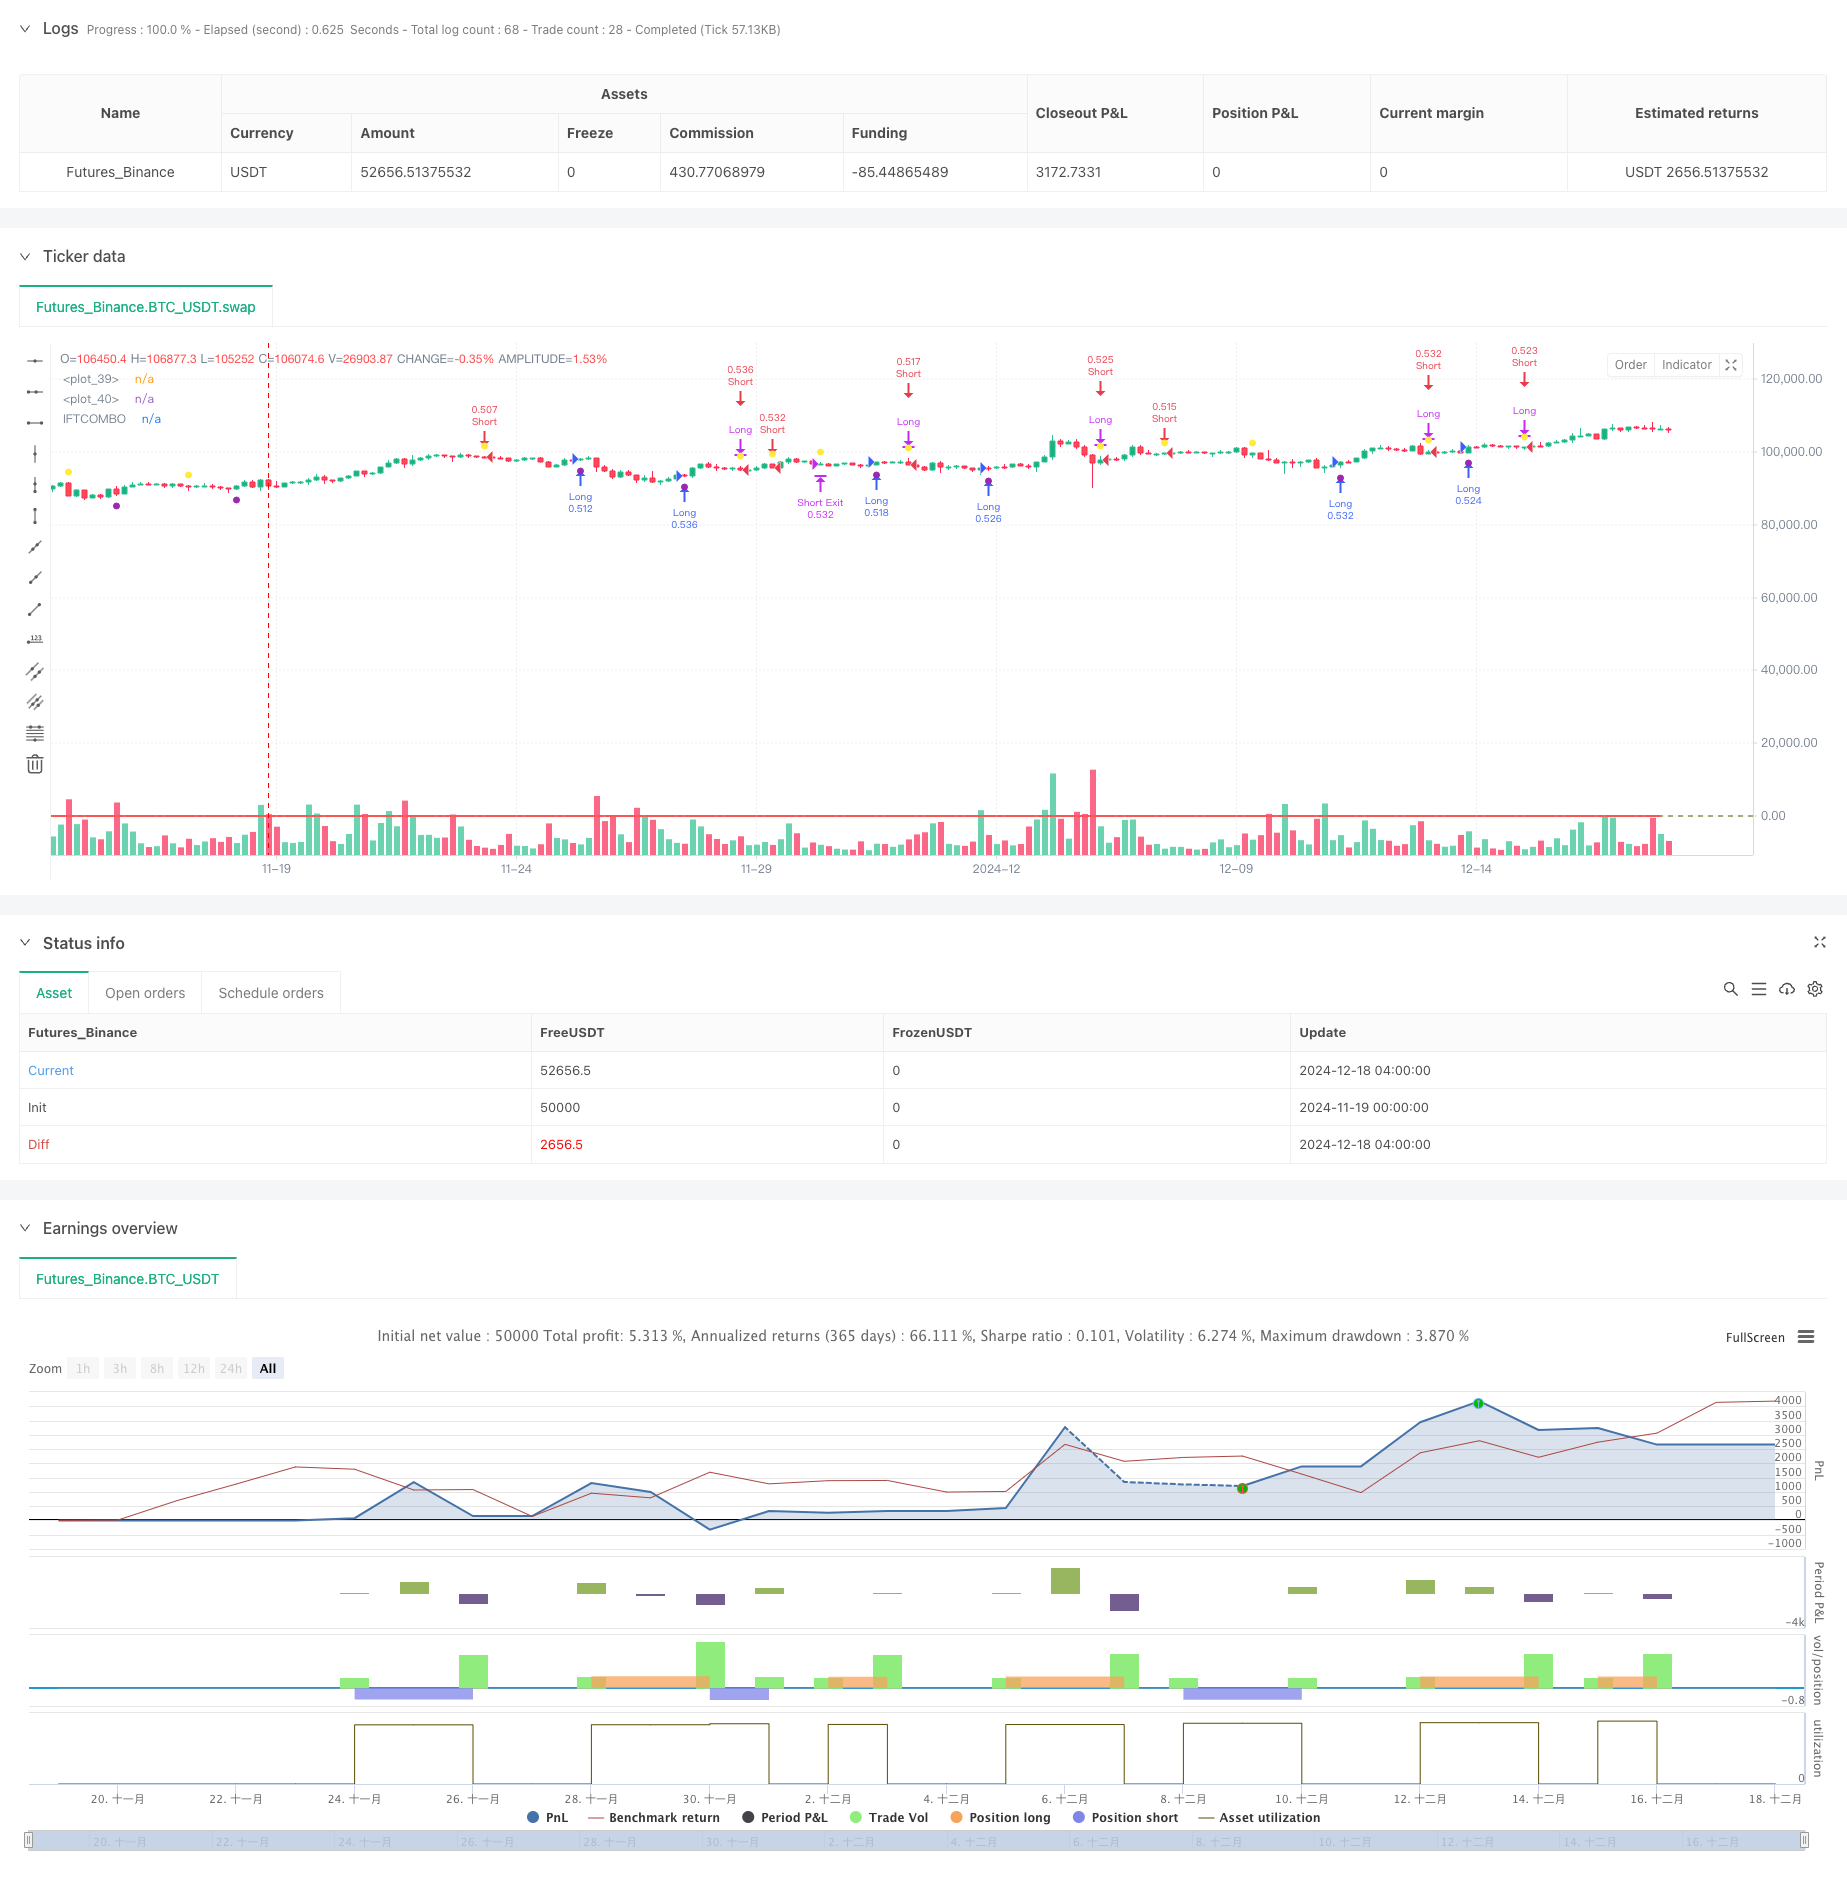
/*backtest
start: 2024-11-19 00:00:00
end: 2024-12-18 08:00:00
period: 4h
basePeriod: 4h
exchanges: [{"eid":"Futures_Binance","currency":"BTC_USDT"}]
*/

//@version=5
strategy('wombocombo', overlay=true, default_qty_type=strategy.percent_of_equity, default_qty_value=100)

// IFTCOMBO Hesaplamaları
ccilength = input.int(5, 'CCI Length')
wmalength = input.int(9, 'Smoothing Length')
rsilength = input.int(5, 'RSI Length')
stochlength = input.int(5, 'STOCH Length')
mfilength = input.int(5, 'MFI Length')

// CCI
v11 = 0.1 * (ta.cci(close, ccilength) / 4)
v21 = ta.wma(v11, wmalength)
INV1 = (math.exp(2 * v21) - 1) / (math.exp(2 * v21) + 1)

// RSI
v12 = 0.1 * (ta.rsi(close, rsilength) - 50)
v22 = ta.wma(v12, wmalength)
INV2 = (math.exp(2 * v22) - 1) / (math.exp(2 * v22) + 1)

// Stochastic
v1 = 0.1 * (ta.stoch(close, high, low, stochlength) - 50)
v2 = ta.wma(v1, wmalength)
INVLine = (math.exp(2 * v2) - 1) / (math.exp(2 * v2) + 1)

// MFI
source = hlc3
up = math.sum(volume * (ta.change(source) <= 0 ? 0 : source), mfilength)
lo = math.sum(volume * (ta.change(source) >= 0 ? 0 : source), mfilength)
mfi = 100.0 - 100.0 / (1.0 + up / lo)
v13 = 0.1 * (mfi - 50)
v23 = ta.wma(v13, wmalength)
INV3 = (math.exp(2 * v23) - 1) / (math.exp(2 * v23) + 1)

// Ortalama IFTCOMBO değeri
AVINV = (INV1 + INV2 + INVLine + INV3) / 4

// Sinyal çizgileri
hline(0.5, color=color.red, linestyle=hline.style_dashed)
hline(-0.5, color=color.green, linestyle=hline.style_dashed)

// IFTCOMBO çizgisi
plot(AVINV, color=color.red, linewidth=2, title='IFTCOMBO')

// Long Trading Sinyalleri
longCondition = ta.crossover(AVINV, -0.5)
longCloseCondition = ta.crossunder(AVINV, 0.5)

// Short Trading Sinyalleri
shortCondition = ta.crossunder(AVINV, 0.5)
shortCloseCondition = ta.crossover(AVINV, -0.5)

// Stop-loss seviyesi (%0.5 kayıp)
stopLoss = strategy.position_avg_price * (1 - 0.005) // Long için
takeProfit = strategy.position_avg_price * (1 + 0.01) // Long için


// Long Strateji Kuralları
if longCondition
    strategy.entry('Long', strategy.long)
    strategy.exit('Long Exit', 'Long', stop=stopLoss, limit=takeProfit) // Stop-loss eklendi


if longCloseCondition
    strategy.close('Long')

// Stop-loss seviyesi (%0.5 kayıp)
stopLossShort = strategy.position_avg_price * (1 + 0.005) // Short için
takeProfitShort = strategy.position_avg_price * (1 - 0.01) // Short için

// Short Strateji Kuralları
if shortCondition
    strategy.entry('Short', strategy.short)
    strategy.exit('Short Exit', 'Short', stop=stopLossShort, limit=takeProfitShort) // Stop-loss eklendi


if shortCloseCondition
    strategy.close('Short')

// Sinyal noktalarını plotlama
plotshape(longCondition, title='Long Signal', location=location.belowbar, color=color.purple, size=size.small)
plotshape(shortCondition, title='Short Signal', location=location.abovebar, color=color.yellow, size=size.small)