Multi-Technical Indicator Cross-Trend Tracking Strategy: RSI and Stochastic RSI Synergy Trading System

Overview
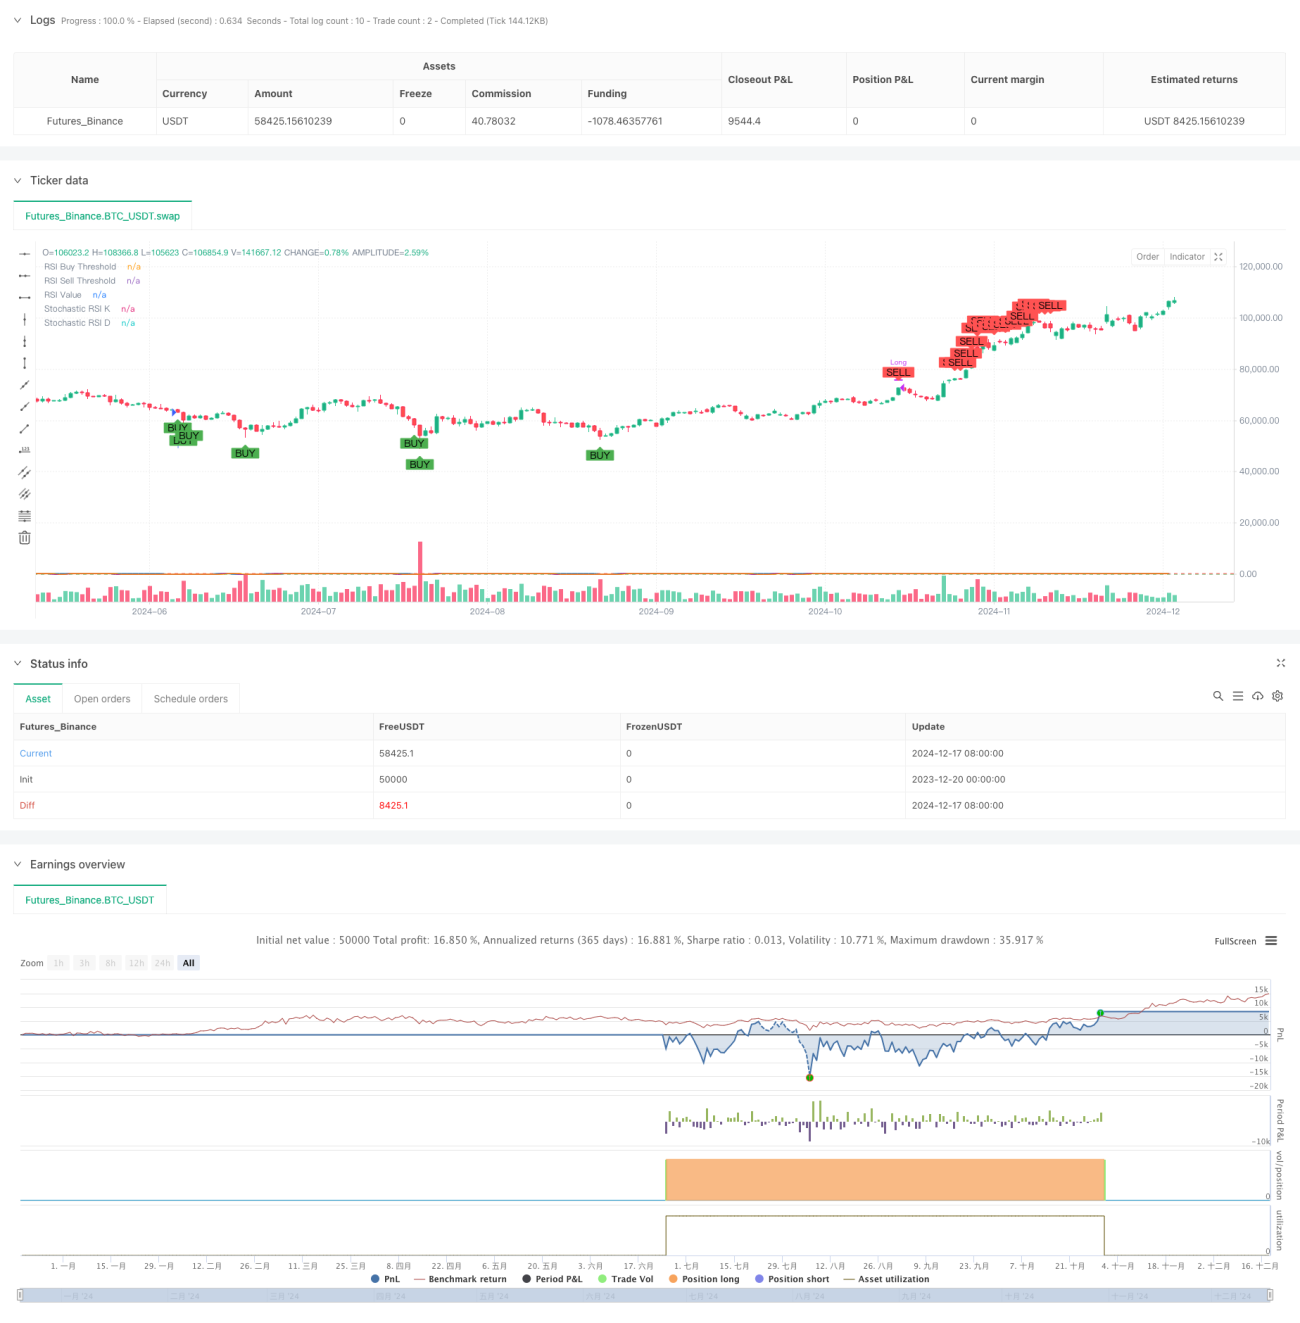
This strategy is a trend-following trading system based on the Relative Strength Index (RSI) and Stochastic RSI indicators. The strategy monitors overbought and oversold levels of both RSI and Stochastic RSI to execute trades when market signals appear. It supports both daily and weekly timeframes, providing traders with flexible trading options.
Strategy Principles
The strategy primarily relies on two technical indicators: RSI and Stochastic RSI. RSI measures the speed and magnitude of price movements, while Stochastic RSI applies stochastic calculations to RSI values to provide more sensitive overbought and oversold signals. Buy signals are triggered when RSI falls below 35 and Stochastic RSI K-value drops below 20, indicating oversold conditions. Sell signals are triggered when RSI rises above 70 and Stochastic RSI K-value exceeds 80, indicating overbought conditions. The strategy employs Simple Moving Averages (SMA) to smooth the Stochastic RSI K-line and D-line, reducing false signals.
Strategy Advantages
- Dual confirmation mechanism: Combining RSI and Stochastic RSI reduces the impact of false signals.
- Flexible timeframes: Supports both daily and weekly timeframes, accommodating different trading styles.
- Strong parameter adaptability: Traders can adjust RSI and Stochastic RSI parameters based on market conditions.
- Good visualization: Strategy provides clear buy/sell signal markers and indicator line visualization.
- Systematic approach: Clear strategy logic with defined entry and exit rules.
Strategy Risks
- Sideways market risk: May generate frequent trading signals in ranging markets, increasing transaction costs.
- Trend reversal risk: In strong trend markets, the strategy might exit positions early due to overbought/oversold signals.
- Parameter sensitivity: Different parameter settings can lead to significantly different trading results.
- Lag risk: Technical indicators inherently have lag, potentially causing delayed entry and exit timing.
Strategy Optimization Directions
- Implement trend filters: Add trend indicators like moving averages to execute signals only in clear trends.
- Optimize parameter adaptation: Develop dynamic parameter adjustment mechanisms for automatic market volatility adaptation.
- Add stop-loss mechanisms: Set stop-loss conditions based on ATR or fixed percentages for risk control.
- Incorporate volume confirmation: Integrate volume indicators to improve signal reliability.
- Develop signal strength scoring: Establish a signal strength scoring system to adjust position sizes based on signal strength.
Conclusion
This strategy builds a relatively reliable trading system by combining the advantages of RSI and Stochastic RSI. While it has certain limitations, the strategy holds practical value through proper risk management and continuous optimization. Traders are advised to thoroughly test different parameter combinations and make appropriate adjustments based on market conditions and personal risk preferences before live trading.
- 1