Multi-Indicator Cross-Trend Following Trading Strategy: Quantitative Analysis Based on Stochastic RSI and Moving Average System

Overview
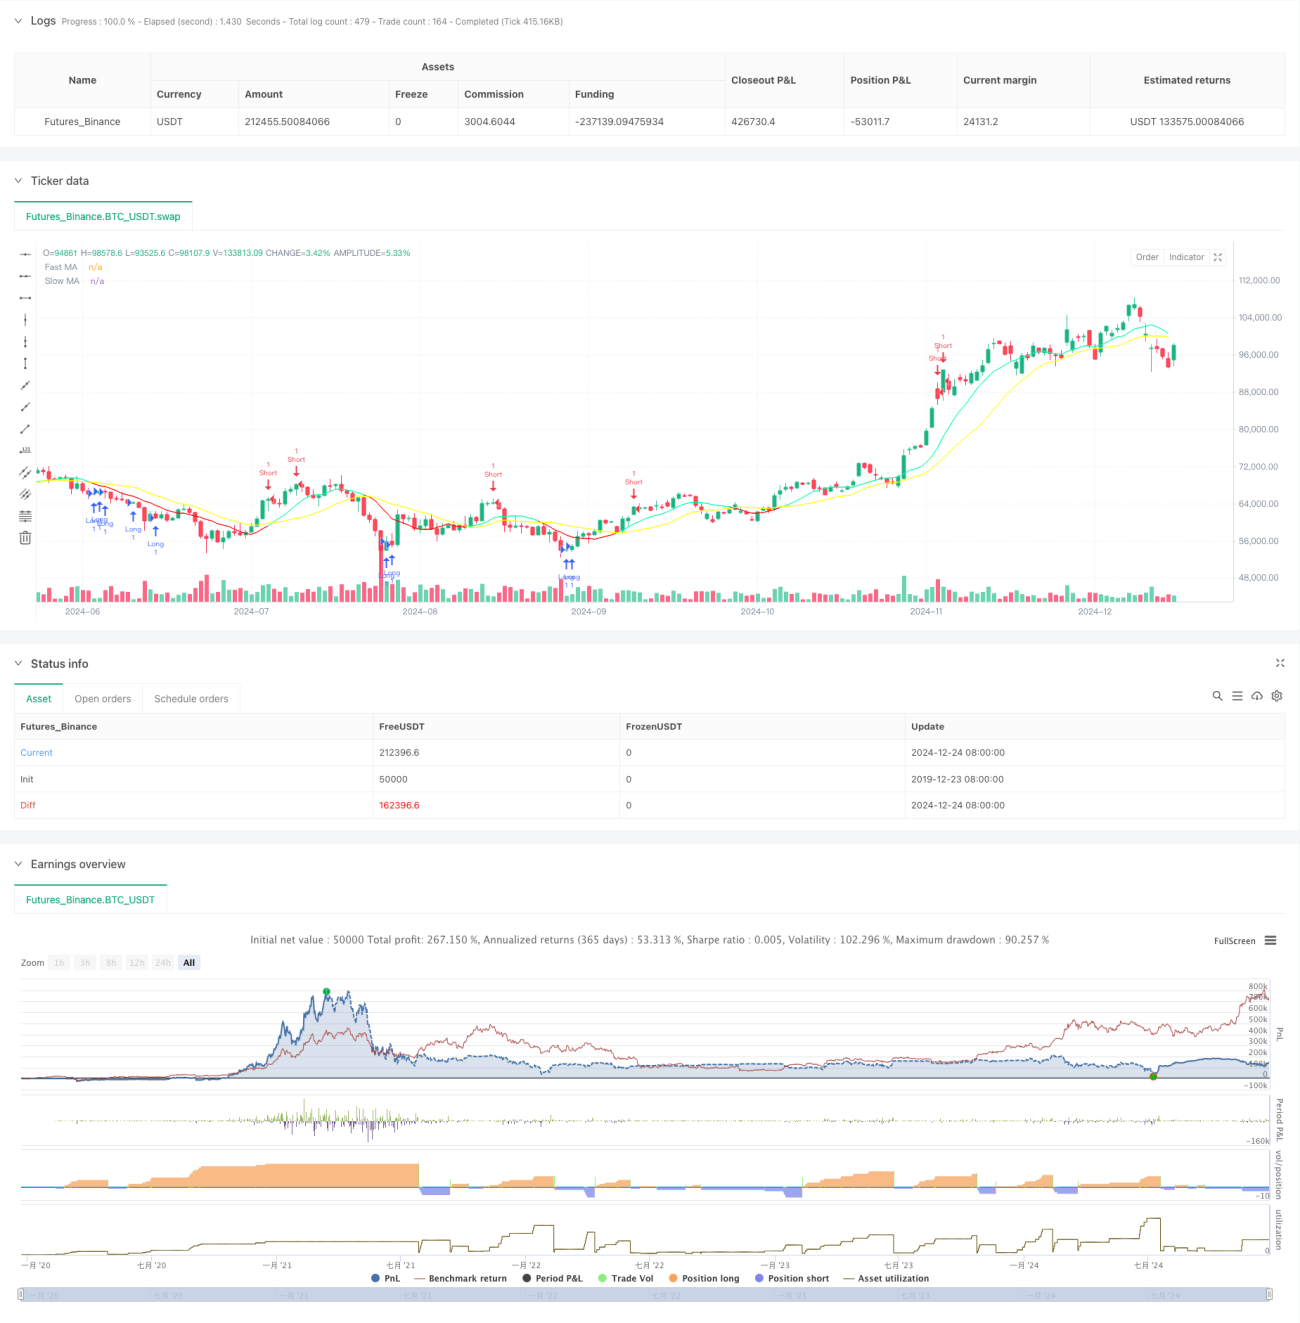
This strategy is a trend-following trading system that combines the Stochastic RSI (Relative Strength Index) and Moving Average indicators. The strategy identifies market trend turning points by analyzing the crossover signals of these two technical indicators, thereby capturing potential trading opportunities. The strategy employs multiple indicator cross-validation methods to effectively reduce false signals and improve trading accuracy.
Strategy Principles
The core logic of the strategy is based on two main indicator systems:
- Stochastic RSI:
- RSI period set to 17, stochastic period set to 20
- K-line and D-line crossovers serve as primary signals
- Long signal triggered when K value is below 17 and D value is below 23, with K line crossing above D line
- Short signal triggered when K value is above 99 and D value is above 90, with K line crossing below D line
- Dual Moving Average System:
- Fast MA period set to 10, slow MA period set to 20
- MA position relationships confirm trend direction
- Crossovers between fast and slow MAs provide supplementary trend reversal signals
Strategy Advantages
- Multiple Indicator Validation: Combines momentum and trend indicators for more reliable trading signals
- Parameter Optimization: Optimized indicator parameters better adapt to market volatility
- Risk Control: Strict signal triggering conditions effectively reduce false signals
- Automated Execution: Strategy can be implemented through automated trading, reducing human intervention
- High Flexibility: Parameters can be adjusted according to different market conditions
Strategy Risks
- Lag Risk: Moving averages inherently have lag, potentially leading to suboptimal entry points
- Oscillation Risk: May generate frequent false signals in ranging markets
- Parameter Sensitivity: Strategy effectiveness is sensitive to parameter settings, requiring periodic optimization
- Market Environment Dependency: Performs well in strong trending markets but may underperform in other market conditions
Strategy Optimization Directions
- Introduce Volatility Filter:
- Add ATR indicator to evaluate market volatility
- Dynamically adjust position size based on volatility levels
- Optimize Signal Confirmation Mechanism:
- Add volume indicator verification
- Incorporate trend strength confirmation indicators
- Improve Risk Management System:
- Implement dynamic stop-loss and take-profit levels
- Optimize position management
Summary
This strategy constructs a relatively complete trend-following trading system by combining Stochastic RSI and Moving Average systems. The strategy's strength lies in its multiple indicator cross-validation mechanism, which effectively reduces interference from false signals. However, attention must be paid to risk control, especially in oscillating markets. Through continuous optimization and improvement, this strategy shows promise for better performance in actual trading.
/*backtest
start: 2019-12-23 08:00:00
end: 2024-12-25 08:00:00
period: 1d
basePeriod: 1d
exchanges: [{"eid":"Futures_Binance","currency":"BTC_USDT"}]
*/

// This Pine Script™ code is subject to the terms of the Mozilla Public License 2.0 at https://mozilla.org/MPL/2.0/
// © Quantuan_Research

//@version=6- 1