Multi-EMA Cross with Oscillator and Dynamic Support/Resistance Trading Strategy

Overview
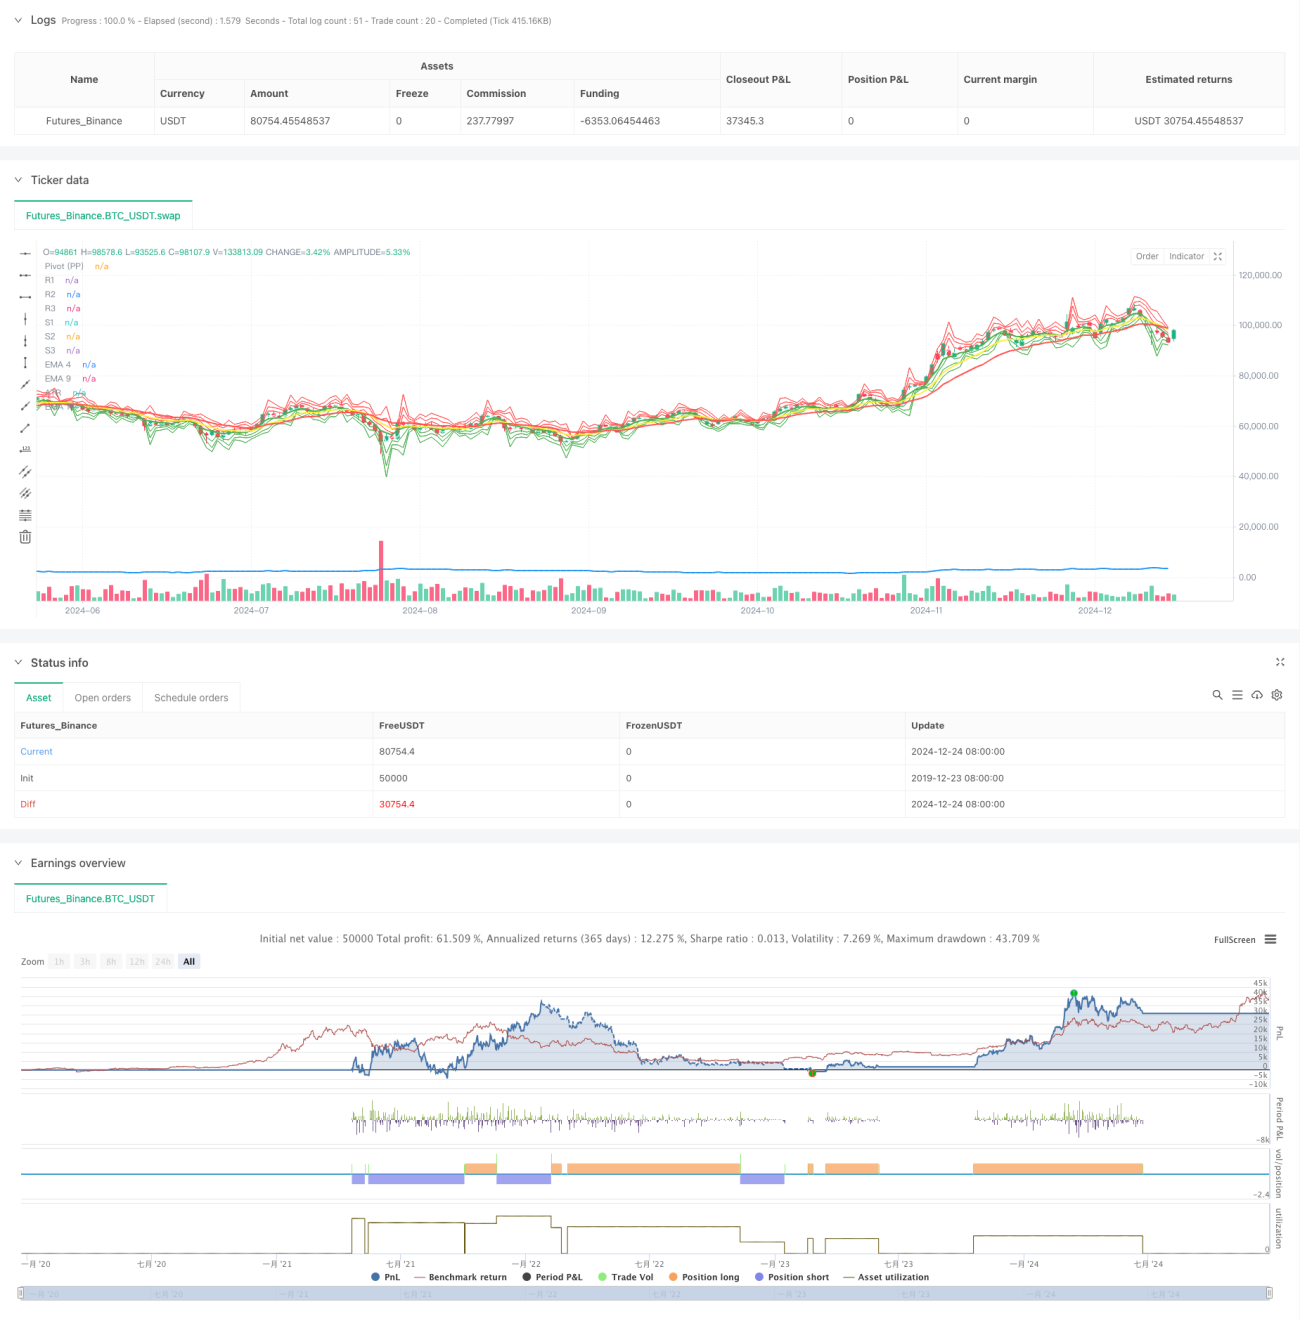
This strategy is a comprehensive trading system that combines multiple Exponential Moving Averages (EMA) crossovers, Average True Range (ATR), and Pivot Points support/resistance levels. It captures market trend reversals by analyzing short-term EMA crosses against medium and long-term EMAs, combined with ATR volatility ranges and key price levels.
Strategy Principles
The strategy is based on three dimensions of technical analysis:
- Trend Identification: Uses triple EMAs (4, 9, and 18 periods), confirming trend direction through synchronized crosses of short-term EMA(4) against medium-term EMA(9) and long-term EMA(18).
- Volatility Range: Incorporates 14-period ATR to quantify market volatility and set dynamic trading thresholds.
- Price Support/Resistance: Implements daily Pivot Points system (PPSignal), establishing 7 key price levels (PP, R1-R3, S1-S3) as reference points.
Trading rules are clearly defined:
- Long Entry: EMA4 crosses above both EMA9 and EMA18, with closing price breaking above EMA9 + ATR
- Short Entry: EMA4 crosses below both EMA9 and EMA18, with closing price breaking below EMA9 - ATR
- Stop Loss: Dynamically tracks EMA4 level
Strategy Advantages
- Multi-dimensional Analysis: Combines trend, volatility, and price structure analysis for improved signal reliability
- Dynamic Adaptation: Adapts to different market conditions through ATR and dynamic support/resistance levels
- Comprehensive Risk Control: Implements dynamic stop-loss mechanism for profit protection and risk management
- Robust Signal Confirmation: Requires multiple technical indicator convergence, reducing false breakout risks
Strategy Risks
- Choppy Market Risk: May generate frequent false signals during consolidation phases
- Lag Risk: Inherent delay in moving averages may miss optimal entry points
- Gap Risk: Overnight gaps may render stop-loss levels ineffective
- Parameter Sensitivity: Different period combinations may produce significantly varying results
Strategy Optimization Directions
- Volume Integration: Add volume confirmation for crossover signals
- Dynamic Parameter Optimization: Adapt EMA periods based on market volatility
- Enhanced Stop-Loss: Consider implementing floating stops based on ATR
- Market Environment Filter: Add trend strength indicators to trade only during strong trends
- Time Filter: Establish optimal trading sessions based on different timeframe characteristics
Summary
This strategy constructs a comprehensive trading system through the synergy of multiple technical indicators. Its core strengths lie in its multi-dimensional signal confirmation mechanism and robust risk control framework, though traders need to optimize parameters and improve the system based on specific market conditions. Through the suggested optimization directions, the strategy's stability and reliability can be further enhanced.
- 1