Cloud-Based Bollinger Bands Double Moving Average Quantitative Trend Strategy

Overview
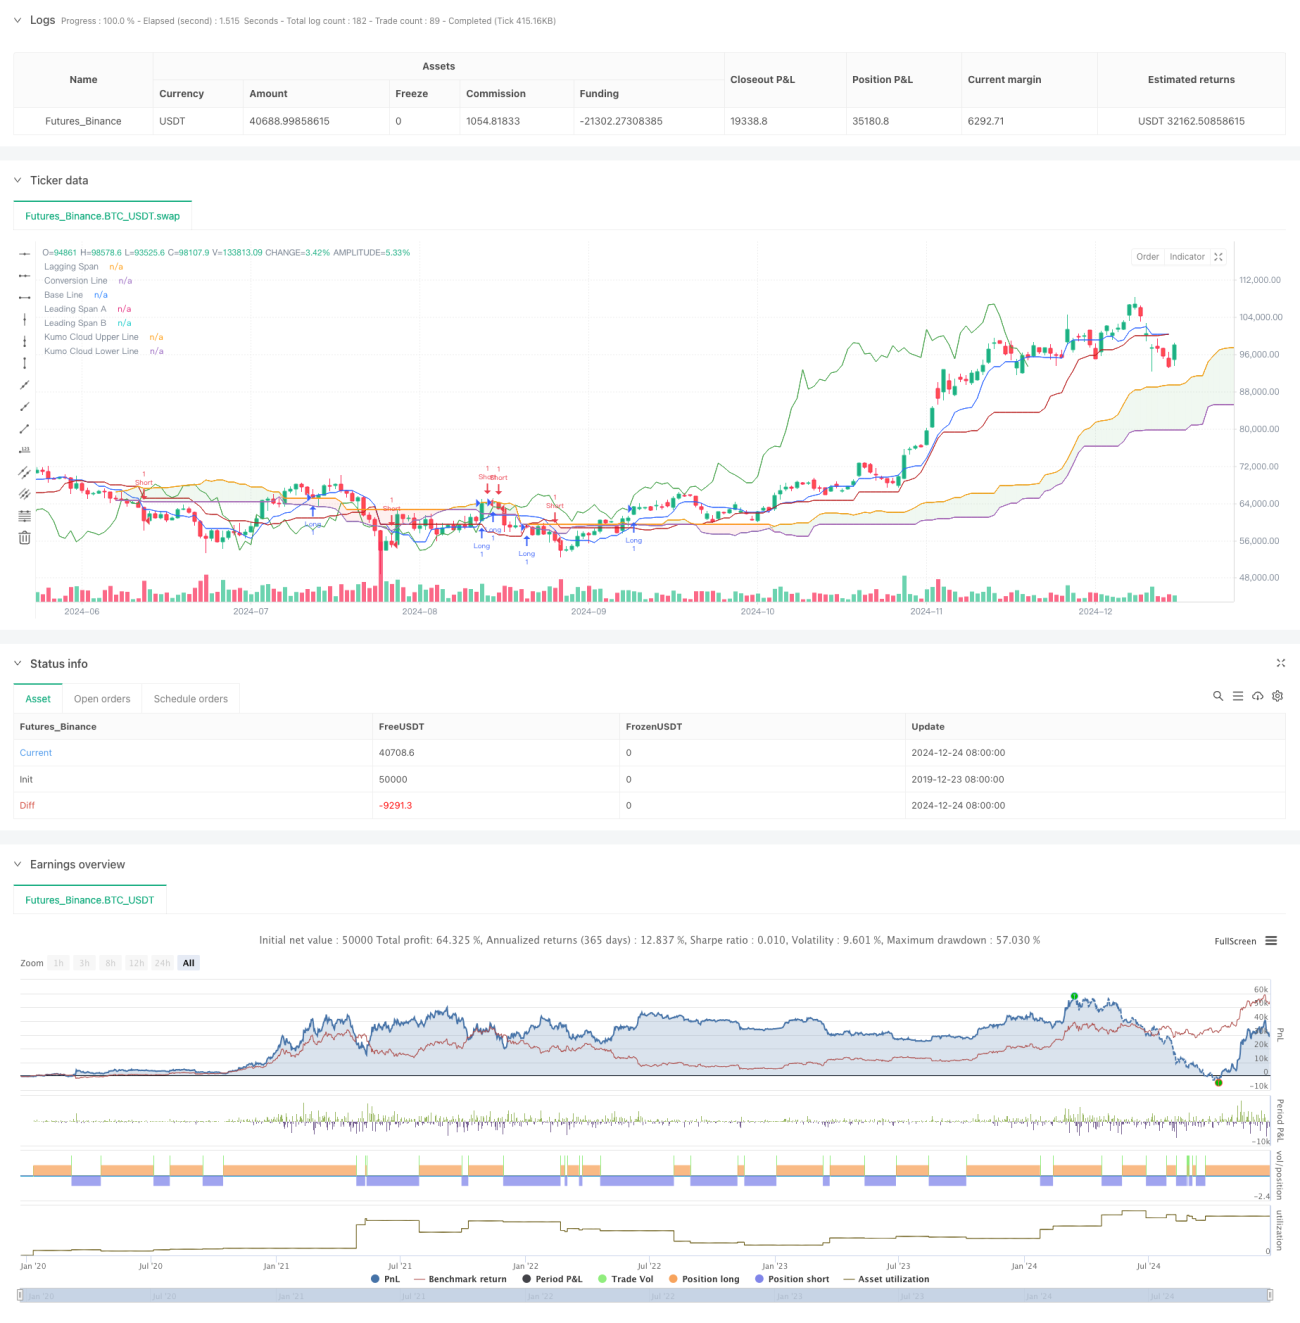
This strategy is a quantitative trading system based on the Ichimoku Cloud. It primarily uses the crossover signals between Leading Span A and Leading Span B to determine market trend direction and generate trading signals. The strategy employs a dynamic price range assessment method, incorporating Donchian Channel calculation principles to effectively capture market trend turning points.
Strategy Principles
The core logic of the strategy is based on the following key components:
- Conversion Line: Uses the 9-period Donchian Channel median as a fast-response indicator
- Base Line: Employs the 26-period Donchian Channel median as a medium-term trend indicator
- Leading Span A: Calculated as the average of the Conversion Line and Base Line
- Leading Span B: Uses the 52-period Donchian Channel median as a long-term trend indicator
- Lagging Span: Shifts the closing price 26 periods backward
Trading signals are triggered under the following conditions:
- Long signal: When Leading Span A crosses above Leading Span B
- Short signal: When Leading Span A crosses below Leading Span B
Strategy Advantages
- Multi-dimensional trend confirmation: Combines indicators of different periods for comprehensive market trend assessment
- High signal reliability: Uses cloud crossovers as signal triggers, effectively filtering false signals
- Robust risk control: The cloud structure inherently provides support and resistance levels, offering natural stop-loss points
- High adaptability: Strategy parameters can be adjusted according to different market characteristics
Strategy Risks
- Lag risk: The use of longer period calculations may result in delayed entry and exit signals
- Sideways market risk: May generate frequent false breakout signals in ranging markets
- Parameter sensitivity: Different parameter combinations may lead to significant variations in strategy performance
- Drawdown risk: May face significant drawdowns during trend reversals
Strategy Optimization Directions
- Incorporate volume indicators: Combine volume changes to confirm trend validity
- Optimize parameter selection: Dynamically adjust parameters based on different market cycle characteristics
- Add auxiliary indicators: Include indicators like RSI or MACD as supplementary confirmation signals
- Improve stop-loss mechanism: Design more flexible stop-loss strategies, such as trailing stops
Summary
This strategy is a quantitative trading system that combines classical technical analysis tools, capturing market opportunities through multi-dimensional trend analysis. While it has some inherent lag, it demonstrates good reliability and adaptability overall. Through continuous optimization and improvement, the strategy has the potential to maintain stable performance across different market conditions.
/*backtest
start: 2019-12-23 08:00:00
end: 2024-12-25 08:00:00
period: 1d
basePeriod: 1d
exchanges: [{"eid":"Futures_Binance","currency":"BTC_USDT"}]
*/

// This Pine Script™ code is subject to the terms of the Mozilla Public License 2.0 at https://mozilla.org/MPL/2.0/
// © mrbakipinarli

//@version=6- 1