Triple Supertrend and Exponential Moving Average Trend Following Quantitative Trading Strategy

Overview
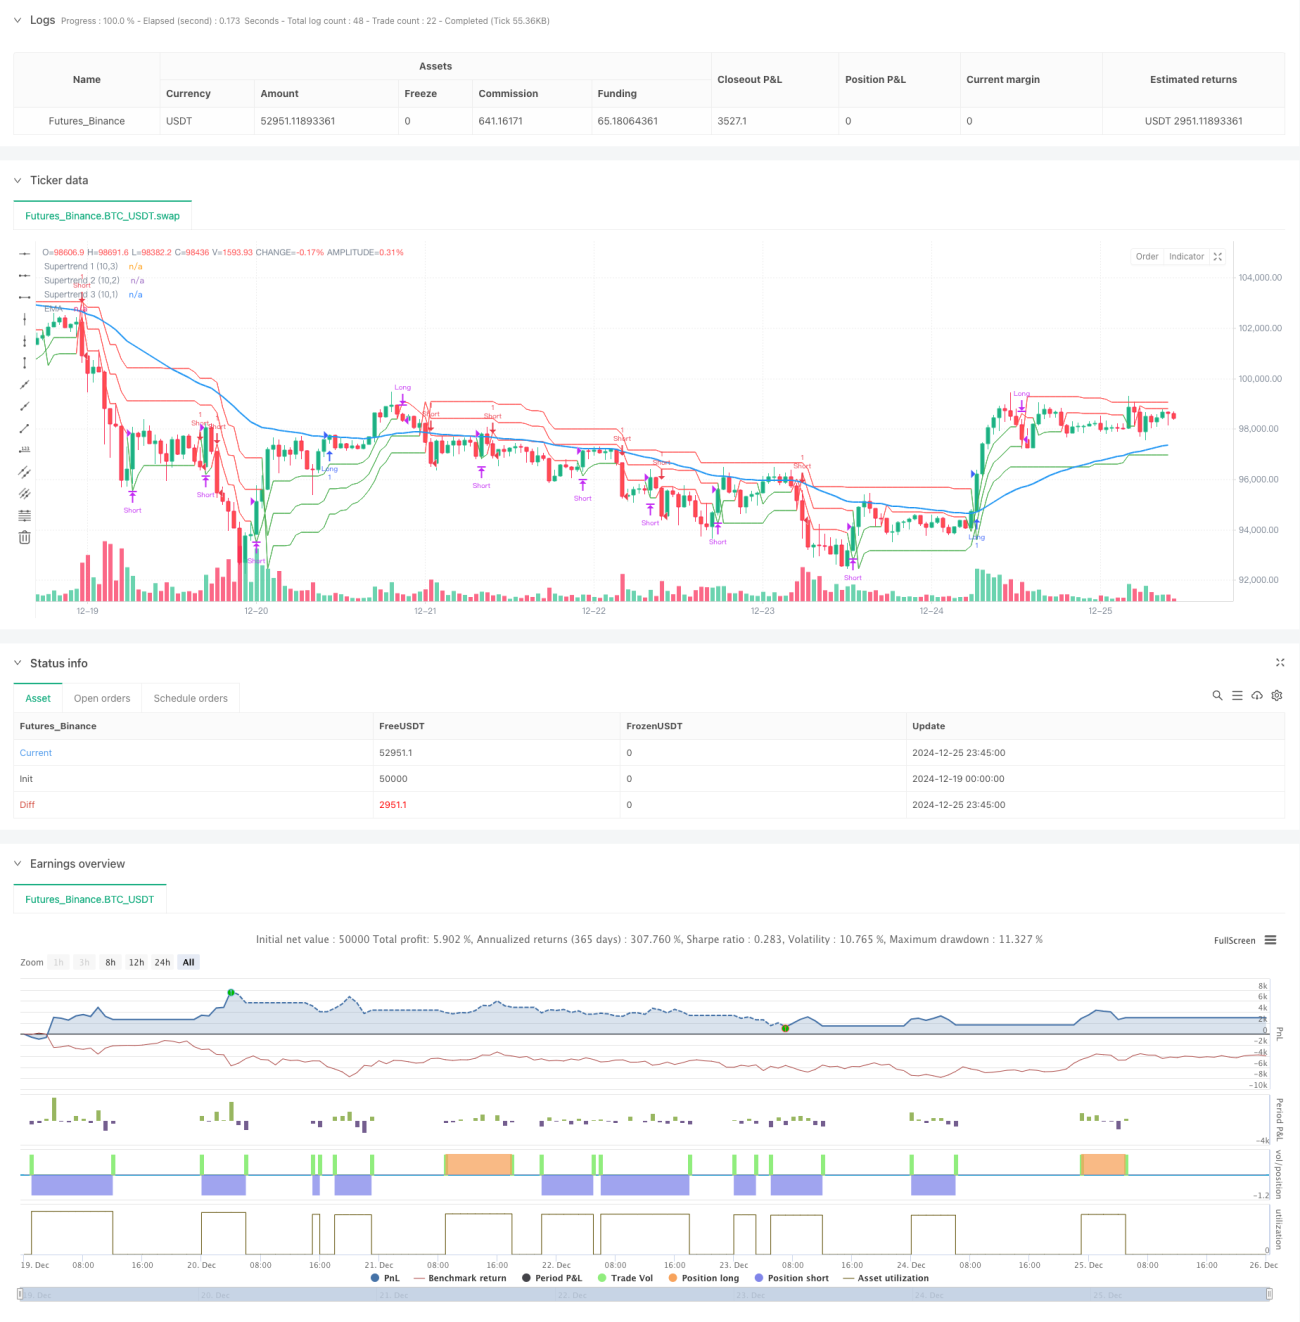
This strategy combines triple Supertrend indicators with an Exponential Moving Average (EMA) for trend following. It uses three Supertrend lines with different sensitivities and one EMA line to capture market trends through multi-dimensional confirmation. The strategy utilizes ATR (Average True Range) to calculate dynamic support/resistance levels and determines trend direction and trading signals based on price positions relative to these lines.
Strategy Principle
The strategy consists of these core components:
- 50-period EMA determines overall trend direction, with price above EMA indicating uptrend and below indicating downtrend.
- Three Supertrend lines calculated using 10-period ATR with multipliers of 3.0, 2.0, and 1.0, decreasing in sensitivity.
- Entry signals: Long when price is above EMA and all three Supertrend lines show bullish signals; Short when price is below EMA and all three Supertrend lines show bearish signals.
- Exit signals: Close positions when the third Supertrend line (least sensitive) reverses direction.
Strategy Advantages
- Multiple confirmation mechanism improves signal reliability and reduces false signals.
- Combines short-term and long-term trend indicators for both quick response and stability.
- Dynamic stop-loss settings that automatically adjust to market volatility.
- Clear strategy logic with adjustable parameters.
- Applicable across multiple market cycles with good universality.
Strategy Risks
-
May generate frequent trades in ranging markets, increasing transaction costs.
Solution: Add signal filters or extend moving average periods. -
Potential lag during trend reversal initiation.
Solution: Incorporate momentum indicators for assistance. -
Multiple confirmation requirements might miss some profitable opportunities.
Solution: Adjust confirmation conditions based on market characteristics.
Strategy Optimization Directions
- Incorporate volume indicators for additional confirmation.
- Develop adaptive parameter mechanisms that adjust dynamically to market conditions.
- Add volatility filters to adjust position sizing during high volatility periods.
- Optimize stop-loss mechanism, considering trailing stops.
- Add drawdown control module with maximum drawdown limits.
Summary
This is a logically rigorous and stable trend-following strategy. Through the combination of multiple technical indicators, it ensures signal reliability while maintaining good risk control capabilities. The strategy parameters are highly adjustable and can be optimized for different market conditions. While there is some inherent lag, appropriate optimization can achieve a good balance between risk and return.
- 1