Dynamic EMA Crossover Strategy with ADX Trend Strength Filtering System

Overview
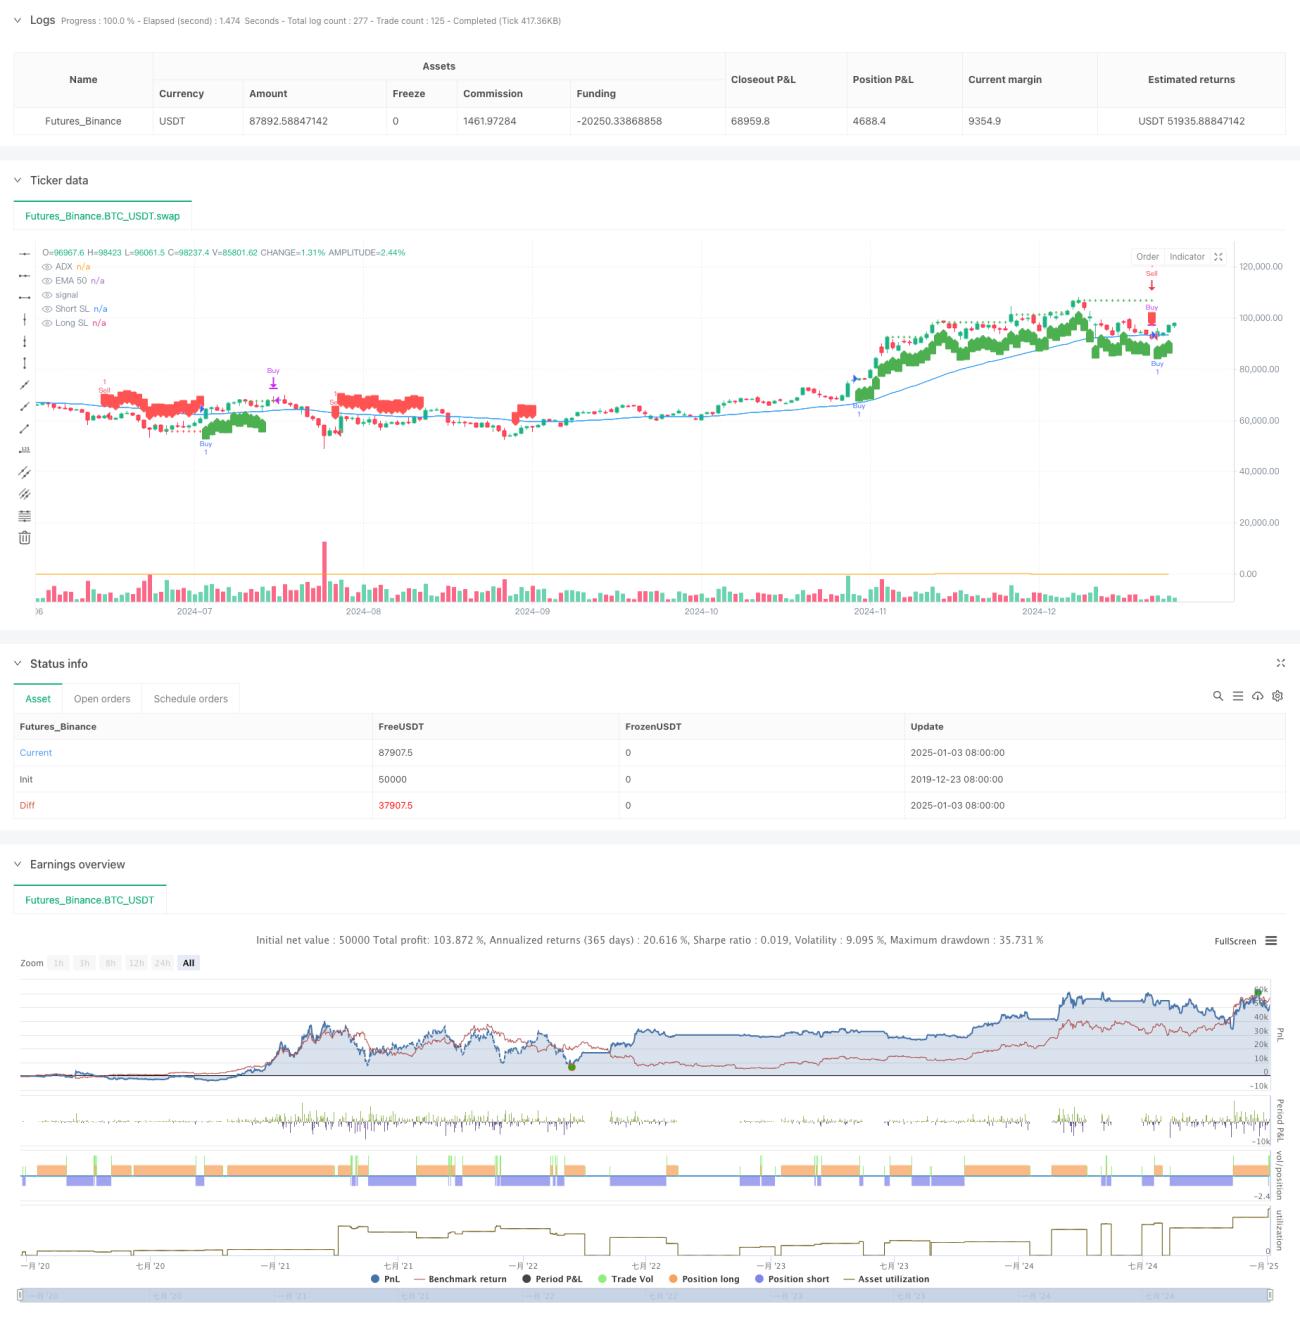
This strategy is a trend-following trading system that combines the Exponential Moving Average (EMA) and Average Directional Index (ADX). It determines trading direction through EMA50 and price crossovers, uses ADX to filter trend strength, and employs a dynamic stop-loss method based on consecutive profitable candles. This approach enables both capturing major market trends and timely exits when trends weaken.
Strategy Principles
The core logic is based on the following key elements:
- Uses 50-period EMA (EMA50) as trend direction indicator
- Filters market trend strength using ADX indicator (default parameter 20)
- Entry conditions:
- Long: Price closes above EMA50 and ADX above threshold
- Short: Price closes below EMA50 and ADX above threshold
- Unique stop-loss mechanism:
- Counts consecutive profitable candles
- Activates dynamic trailing stop after 4 consecutive profitable candles
- Stop-loss level adjusts dynamically with new highs/lows
Strategy Advantages
- Dual Trend Confirmation
- EMA crossover provides trend direction
- ADX filtering ensures trend strength, reduces false breakouts
- Intelligent Stop-Loss Design
- Dynamic stops based on market volatility
- Trailing stop activated only after consecutive profits
- High Adaptability
- Highly adjustable parameters
- Applicable to multiple trading instruments
- Comprehensive Risk Control
- Automatic exit on trend weakness
- Dynamic stops protect existing profits
Strategy Risks
- Trend Reversal Risk
- May face significant drawdowns during sudden reversals
- Recommend adding reversal confirmation mechanism
- Parameter Sensitivity
- Strategy performance affected by EMA and ADX parameter choice
- Recommend parameter optimization through backtesting
- Market Environment Dependency
- May trade frequently in ranging markets
- Recommend adding sideways market filter
- Stop-Loss Execution Risk
- Large gaps may cause stop-loss execution deviation
- Consider implementing hard stop-loss protection
Optimization Directions
- Entry Mechanism Enhancement
- Add volume confirmation signals
- Incorporate price pattern analysis
- Stop-Loss Mechanism Improvement
- Integrate ATR for dynamic stop-loss adjustment
- Add time-based stop-loss mechanism
- Market Environment Adaptation
- Add market volatility filters
- Adjust parameters for different market cycles
- Signal Confirmation Enhancement
- Integrate additional technical indicators
- Add fundamental filtering conditions
Summary
This is a well-designed trend-following strategy that effectively captures trends while controlling risks by combining the advantages of EMA and ADX. The dynamic stop-loss mechanism is particularly innovative, effectively balancing profit protection and trend capture. While there is room for optimization, the overall framework is complete and logically sound, making it a strategy system worth validating in live trading.
- 1