Momentum Trend Ichimoku Cloud Trading Strategy

Overview
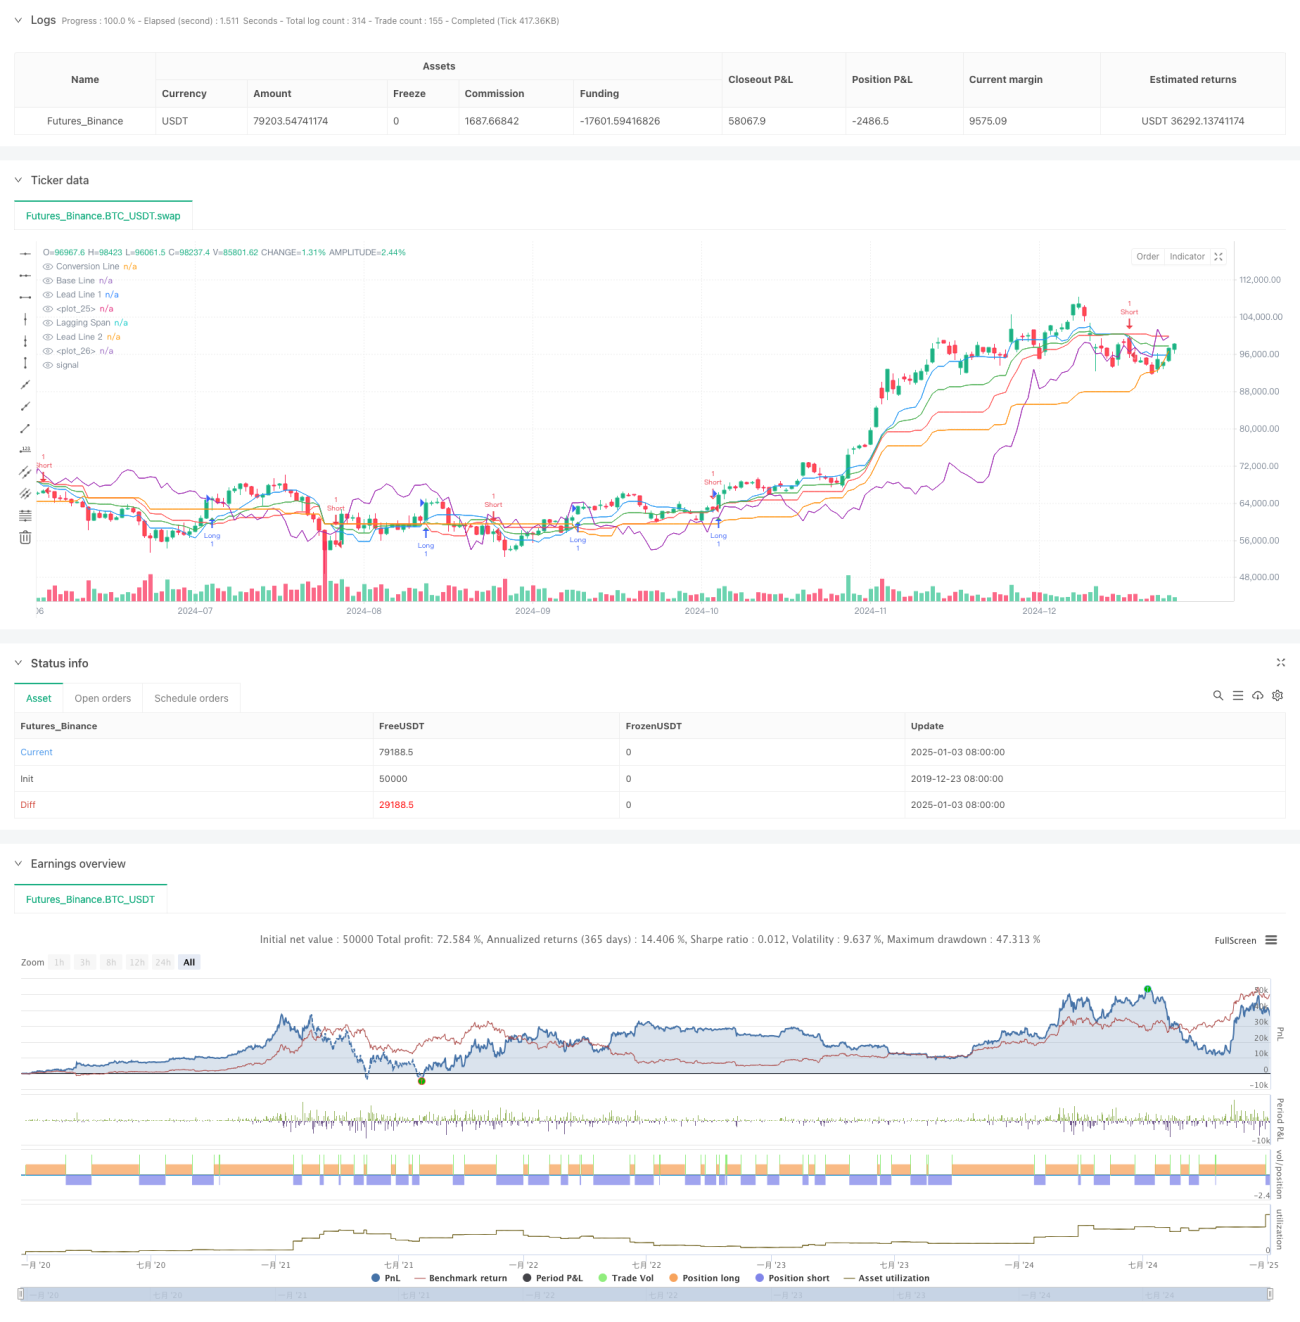
This strategy is a trend-following trading system based on the Ichimoku Cloud indicator. It generates trading signals through the crossover of the Conversion Line and Base Line, while utilizing the Cloud's support and resistance zones to confirm trend direction. The core concept is to identify trend reversal points through dynamic crossovers of multiple-period moving averages and execute trades when trends are established.
Strategy Principles
The strategy is based on several key components:
- Conversion Line (9 periods): Reflects short-term price momentum
- Base Line (26 periods): Reflects medium-term price trends
- Leading Spans 1 and 2: Form the Cloud area, providing support and resistance references
- Lagging Span: Confirms trend persistence
Trade signal triggers:
- Buy Signal: Conversion Line crosses above Base Line
- Sell Signal: Conversion Line crosses below Base Line
Strategy Advantages
- Multi-dimensional Trend Confirmation: Validates trends through multiple dimensions including Conversion Line, Base Line, and Cloud, reducing false breakout risks
- Dynamic Support and Resistance: Cloud area provides dynamic support and resistance levels, adapting to market changes
- Trend Persistence Verification: Uses Lagging Span to verify trend continuation, improving trade reliability
- Parameter Adjustability: All parameters can be optimized for different market characteristics
- Visual Intuitiveness: Cloud visualization makes trend identification more intuitive
Strategy Risks
- Poor Performance in Ranging Markets: May generate frequent false signals in sideways markets
- Lag Risk: May react slowly to trend reversals due to longer-period moving averages
- Parameter Sensitivity: Different parameter settings significantly impact strategy performance
- Market Environment Dependency: Strategy performs well in strong trends but may underperform in other market conditions
- Stop Loss Control: Strategy lacks explicit stop-loss mechanisms
Strategy Optimization Directions
- Incorporate Volatility Filtering: Add ATR indicator to filter small volatility crossover signals
- Integrate Volume Indicators: Combine volume indicators to confirm trend validity
- Optimize Stop Loss Mechanism: Design dynamic stop-loss solutions based on Cloud areas
- Add Trend Strength Filtering: Introduce ADX or similar indicators to filter weak trend environments
- Improve Signal Confirmation: Add price pattern analysis to enhance signal reliability
Summary
The strategy provides a systematic framework for trading decisions through multi-dimensional Ichimoku Cloud analysis. Its strength lies in comprehensive trend capture, though it faces certain limitations in terms of lag and market environment dependency. The strategy's practicality and reliability can be further enhanced by introducing supplementary indicators and optimizing signal confirmation mechanisms. In practical application, it is recommended to optimize parameters based on specific market characteristics and combine with other technical indicators to enhance strategy stability.
- 1