Advanced Pressure Reversal and Candlestick Overlap Strategy

Overview
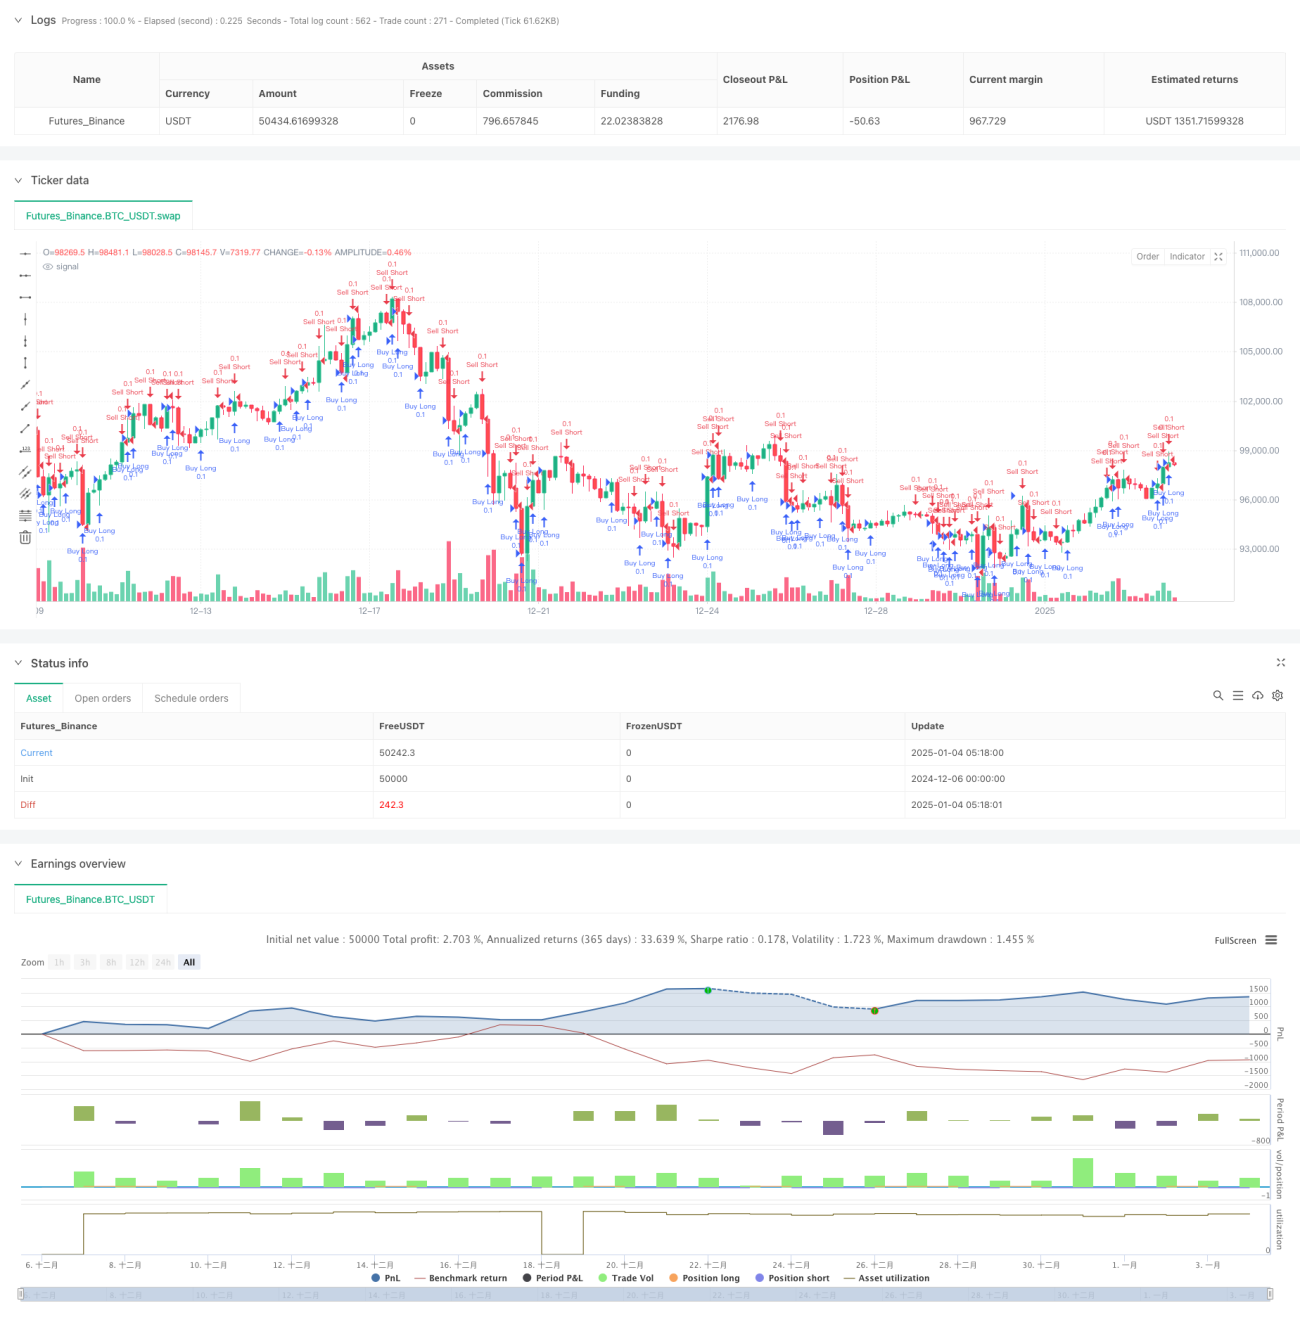
This is a quantitative trading strategy based on market pressure and candlestick overlap patterns. The strategy identifies potential market reversal points by analyzing trading volume, candlestick patterns, and price overlap relationships, combined with take-profit conditions for automated trading. The strategy uses fixed position sizing and sets a 20% take-profit target.
Strategy Principle
The core logic of the strategy incorporates two main dimensions: market pressure and candlestick overlap. For market pressure, the strategy determines buying and selling pressure by comparing current trading volume with the 20-period volume moving average. When the volume of a green candle (bullish) exceeds the moving average, it indicates buying pressure; when the volume of a red candle (bearish) exceeds the moving average, it indicates selling pressure. For candlestick overlap, the strategy focuses on the overlap relationship between adjacent candles. When a green candle overlaps with the previous red candle, it's considered a potential long signal; when a red candle overlaps with the previous green candle, it's considered a potential short signal.
Strategy Advantages
- Multi-dimensional signal verification: Combines volume, candlestick patterns, and price overlap for signal confirmation, improving trading reliability.
- Fixed take-profit target: Sets a clear 20% take-profit target, helping control risk and lock in profits.
- High automation level: Strategy executes completely automatically without manual intervention.
- Clear position management: Uses fixed position sizing for trading, facilitating risk control.
- Logical signal construction: Identifies market pressure through comparison of current volume with moving average, maintaining rigorous logic.
Strategy Risks
- Market volatility risk: In highly volatile markets, take-profit targets may be difficult to achieve or trigger too quickly.
- False breakout risk: Candlestick overlap patterns may produce false breakouts, leading to incorrect signals.
- Slippage risk: Actual trading may experience entry price deviations due to slippage.
- Liquidity risk: In markets with insufficient liquidity, trades may be difficult to execute at desired prices.
- Fixed take-profit limitation: The uniform 20% take-profit target may not suit all market conditions.
Strategy Optimization Directions
- Dynamic take-profit: Adjust take-profit targets based on market volatility for better adaptability.
- Signal filtering: Add trend filtering conditions, such as moving average systems, to reduce false breakouts.
- Position optimization: Introduce dynamic position management to adjust trading volume based on market volatility.
- Time filtering: Add trading time window restrictions to avoid unfavorable trading periods.
- Indicator combination: Consider combining other technical indicators, such as RSI or MACD, to increase signal reliability.
Summary
The strategy captures market reversal opportunities by combining market pressure and candlestick overlap patterns, demonstrating solid theoretical foundation and practical feasibility. Its strengths lie in multi-dimensional signal verification and clear risk control, though it faces certain market risks and has room for optimization. Through further optimization and refinement, the strategy shows potential for improved performance in actual trading.
- 1