
Overview
This strategy is a momentum tracking trading system based on Bollinger Bands indicator. It identifies potential breakout opportunities by monitoring the relationship between price and the upper Bollinger Band, and closes positions when price breaks below the lower band. Bollinger Bands consist of three lines: the middle band (moving average), upper and lower bands (calculated using standard deviation). The strategy supports multiple types of moving averages and allows parameter adjustment based on trader preferences.
Strategy Principles
The core logic of the strategy is based on the following points:
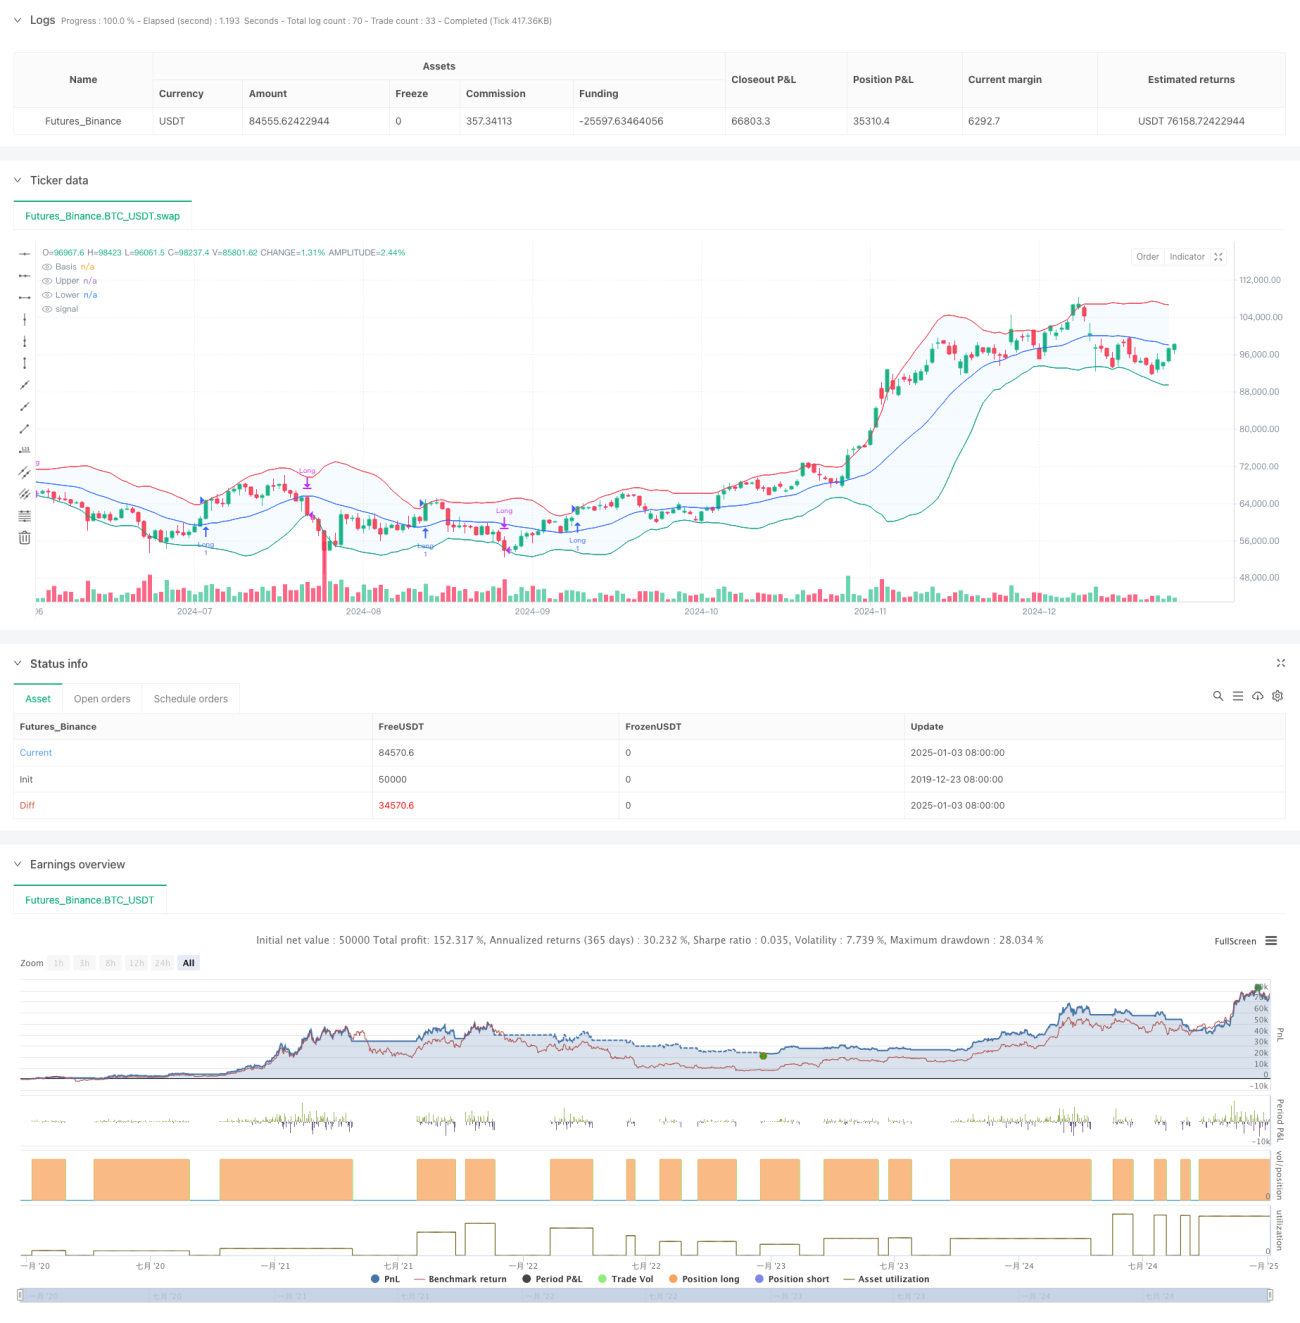
- Entry Signal: When the closing price breaks above the upper Bollinger Band, indicating a potential strong uptrend, a long position is opened.
- Exit Signal: When the closing price falls below the lower Bollinger Band, suggesting momentum exhaustion, the position is closed.
- Bollinger Bands Calculation: The middle band uses selectable moving average types (SMA, EMA, SMMA, WMA, VWMA), and band width is determined by standard deviation multiplier.
- Trade Management: The strategy executes trades within a specified time window, uses 100% capital per trade, and considers commission and slippage factors.
Strategy Advantages
- High Adaptability: Supports multiple moving average types and parameter adjustments to adapt to different market conditions.
- Robust Risk Management: Effectively controls risk using the lower Bollinger Band as a stop-loss point.
- Breakout Confirmation: Uses upper Bollinger Band as entry point to filter false breakouts.
- Rational Capital Management: Adopts fixed proportion capital management to avoid excessive leverage.
- Transaction Cost Consideration: Incorporates commission and slippage for more realistic trading conditions.
Strategy Risks
- Sideways Market Risk: Prone to false signals in range-bound markets.
- Lag Risk: Moving averages have inherent lag, potentially missing optimal entry points.
- Parameter Sensitivity: Different parameter combinations may lead to significant performance variations.
- Capital Usage Risk: 100% capital allocation may result in substantial drawdowns.
Strategy Optimization Directions
- Add Trend Confirmation Indicators: Include indicators like ADX to improve entry accuracy.
- Optimize Capital Management: Introduce dynamic position sizing based on market volatility.
- Enhance Profit-Taking Mechanism: Set dynamic take-profit points to capture more gains in strong trends.
- Add Market Environment Filters: Incorporate volatility indicators to avoid trading in unsuitable market conditions.
Summary
This is a trend-following strategy based on Bollinger Bands, capturing market trends by observing the relationship between price and the bands. The strategy is well-designed with good adaptability and risk management mechanisms. Through the suggested optimization directions, the strategy's stability and profitability can be further enhanced. It is particularly suitable for volatile markets, but traders need to adjust parameters and risk control measures according to actual conditions.
/*backtest
start: 2019-12-23 08:00:00
end: 2025-01-04 08:00:00
period: 1d
basePeriod: 1d
exchanges: [{"eid":"Futures_Binance","currency":"BTC_USDT"}]
*/

//@version=5
strategy(title="Demo GPT - Bollinger Bands Strategy", overlay=true, initial_capital=100000, commission_type=strategy.commission.percent, commission_value=0.1, slippage=3)

// Inputs- 1