
Overview
This strategy is an advanced trading system that combines the WaveTrend oscillator indicator with EMA ribbons. By integrating these two technical indicators, it creates a trading strategy capable of accurately capturing market trend reversal points. The strategy employs dynamic stop-loss and take-profit settings to pursue higher returns while protecting capital.
Strategy Principles
The core of the strategy lies in the synergistic use of the WaveTrend indicator and eight EMA lines to identify trading signals. The WaveTrend indicator measures market overbought and oversold conditions by calculating the deviation between price and moving averages. The EMA ribbon confirms trend direction through crossovers of different period moving averages. Specifically:
- Long signals are triggered when EMA2 crosses above EMA8, or when a blue triangle signal appears (EMA2 crosses above EMA3) without a blood diamond pattern
- Short signals are triggered when EMA8 crosses above EMA2, or when a blood diamond pattern appears
- Stop-loss is set at the extreme point after the previous counter signal, effectively controlling risk
- Take-profit targets are set at 2-3 times the stop-loss distance, demonstrating a good risk-reward ratio
Strategy Advantages
- Dual confirmation mechanism improves trading signal reliability
- Dynamic stop-loss settings better adapt to market volatility
- Clear risk-reward ratio settings
- EMA ribbon helps determine overall market trends
- WaveTrend indicator effectively identifies market overbought/oversold conditions
- Clear strategy logic that's easy to understand and execute
Strategy Risks
- May generate frequent false signals in ranging markets
- Dynamic stops may be easily triggered during severe volatility
- Indicators based on historical data may fail during market regime changes
- Multiple technical indicators may lead to signal lag
Solutions:
- Add volatility filters to reduce false signals in ranging markets
- Consider using wider stop-loss settings
- Add trend strength confirmation mechanisms
Optimization Directions
- Introduce volatility indicators (like ATR) for dynamic stop-loss adjustment
- Add volume confirmation mechanism to improve signal reliability
- Consider adding trend strength filters to trade only in strong trend markets
- Optimize WaveTrend parameters for better adaptation to different market conditions
- Study signal synergy across different timeframes
Summary
This is a complete trading system that combines trend following and oscillator indicators in technical analysis. Through the coordinated use of WaveTrend and EMA ribbons, it can both capture major trends and enter timely at trend reversal points. The dynamic stop-loss and take-profit management mechanism provides good risk control capability. Strategy optimization potential mainly lies in improving signal filtering and risk management.
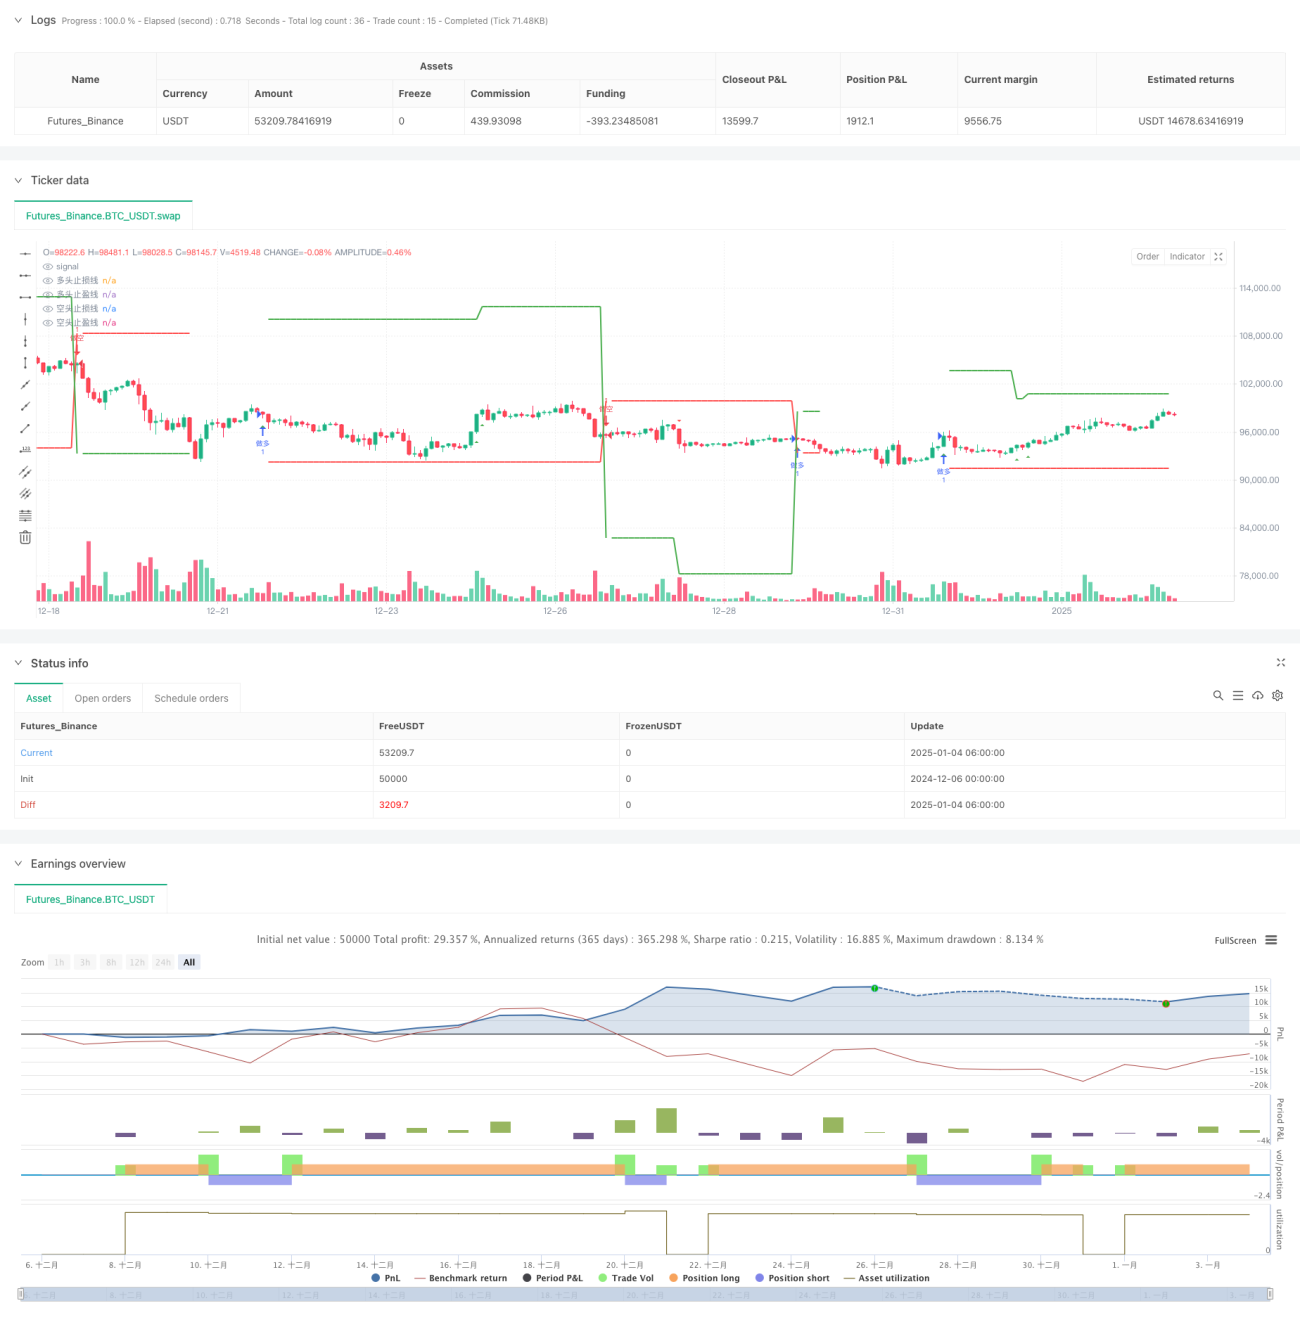
/*backtest
start: 2024-12-06 00:00:00
end: 2025-01-04 08:00:00
period: 2h
basePeriod: 2h
exchanges: [{"eid":"Futures_Binance","currency":"BTC_USDT"}]
*/

//@version=5
strategy("VuManChu Cipher A Strategy", overlay=true, initial_capital=10000, default_qty_type=strategy.fixed, default_qty_value=1.0)

// === 函数定义 ===- 1