
Overview
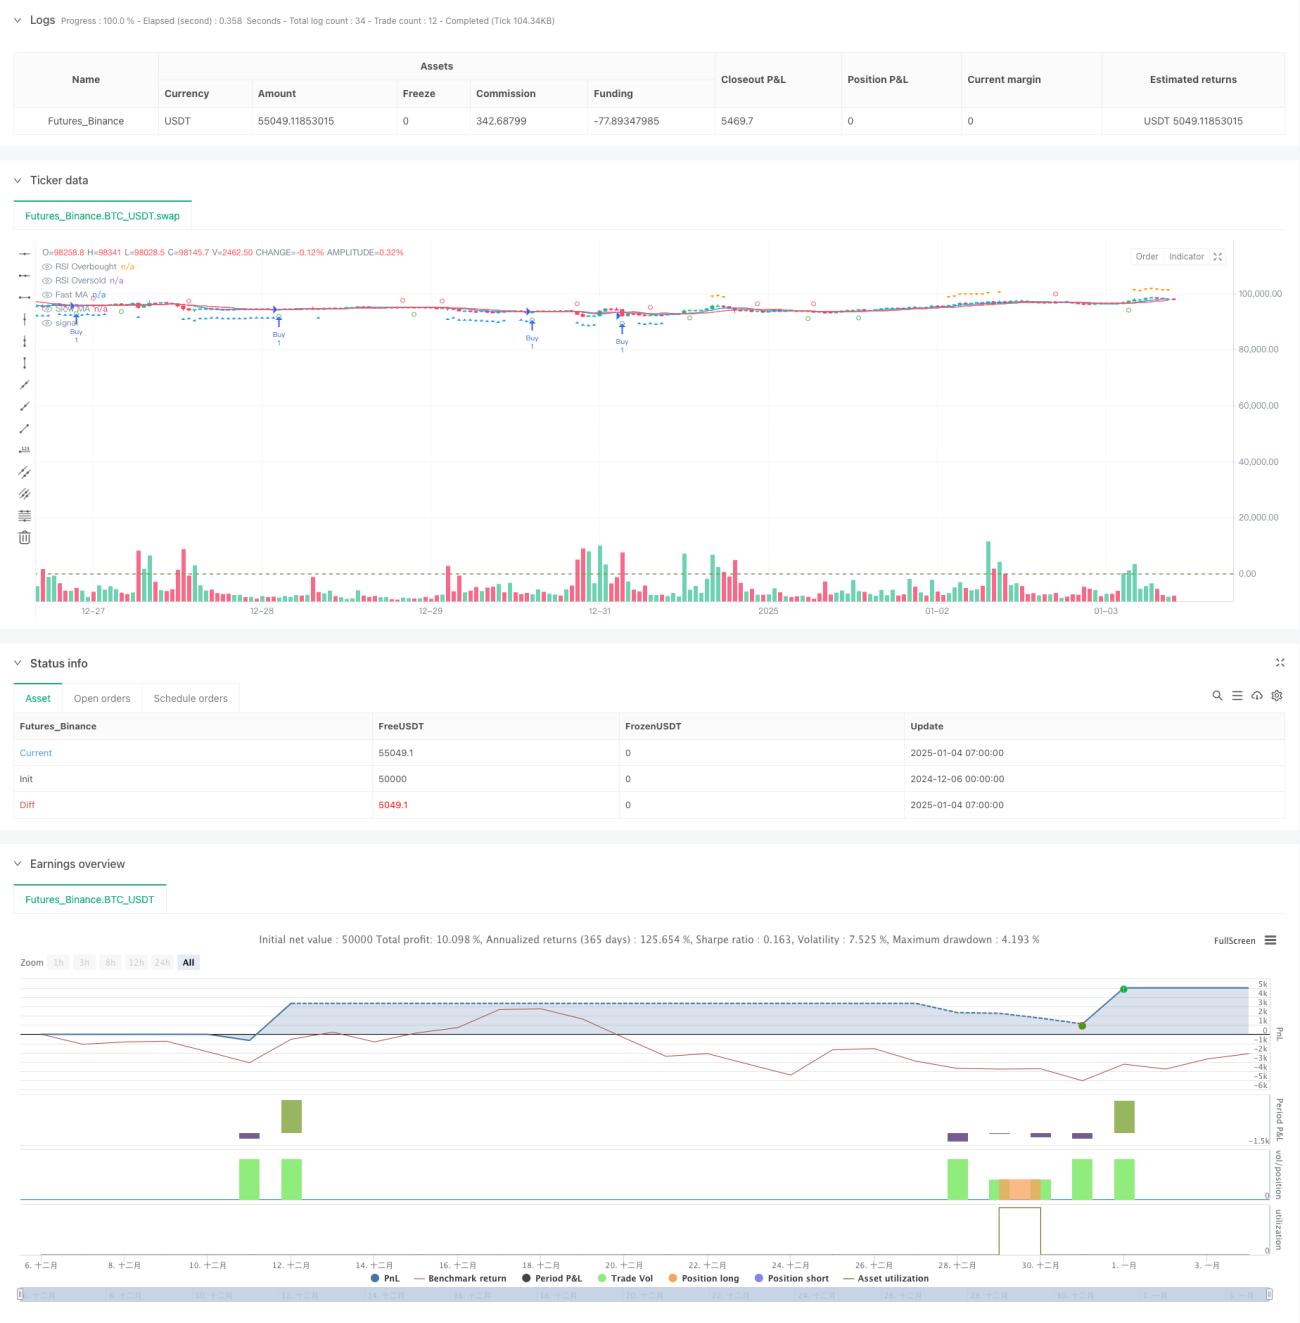
This strategy is a quantitative trading system based on moving average crossovers and RSI indicators, primarily designed for options market trading. The strategy utilizes fast and slow moving average crossover signals combined with RSI overbought/oversold levels to determine trading opportunities, while implementing take-profit and stop-loss mechanisms for risk control. The strategy is optimized for 5-minute timeframe trading.
Strategy Principles
The strategy employs two key technical indicators: Moving Averages (MA) and Relative Strength Index (RSI). Specifically:
- Uses 7-period and 13-period Simple Moving Averages (SMA) to capture price trends
- Employs 17-period RSI to identify overbought/oversold conditions
- Generates long signals when fast MA crosses above slow MA and RSI is below 43
- Generates short signals when fast MA crosses below slow MA and RSI is above 64
- Implements 4% take-profit and 0.5% stop-loss for risk management
Strategy Advantages
- Multiple confirmation mechanism: Combines MA crossovers and RSI indicators for more reliable trading signals
- Comprehensive risk management: Fixed percentage take-profit and stop-loss effectively control risk
- High adaptability: Parameters can be flexibly adjusted for different market conditions
- Visual support: Strategy provides clear graphical indicators for better market understanding
- Clear operational rules: Explicit entry and exit conditions reduce subjective judgment interference
Strategy Risks
- Choppy market risk: May generate frequent false signals in range-bound markets
- Slippage risk: Potential significant slippage in low liquidity options markets
- Parameter sensitivity: Strategy performance is sensitive to parameter settings, requiring continuous optimization
- Market environment dependence: Stop-loss might not be timely in highly volatile market conditions
- Systemic risk: Stop-loss may fail during market gaps or major events
Strategy Optimization Directions
- Incorporate volatility indicators: Consider adding ATR or Bollinger Bands to the decision system
- Optimize parameter adaptation: Develop dynamic parameter adjustment mechanisms based on market states
- Add market sentiment filtering: Integrate volume indicators to filter false signals
- Improve stop-loss mechanism: Consider implementing trailing stops for better risk management
- Add time filtering: Incorporate trading time windows to avoid inefficient trading periods
Summary
The strategy constructs a relatively complete trading system by combining MA crossovers and RSI indicators. Its strengths lie in multiple signal confirmation and comprehensive risk management, while attention must be paid to the impact of market conditions on strategy performance. Through continuous optimization and improvement, the strategy shows promise for stable performance in options markets. Traders are advised to conduct thorough backtesting and parameter optimization before live implementation.
- 1