
This strategy is an intelligent trading system based on the Stochastic Oscillator. It combines dynamic trend identification, multiple signal confirmation, and intelligent risk management capabilities to automatically identify market overbought/oversold conditions and execute trades. The strategy uses a color-coding system to visually display market conditions, integrates multiple period moving averages (EMA) for trend confirmation, and provides flexible stop-loss and take-profit settings.
The core of the strategy is based on the combination of the Stochastic Oscillator and multiple moving average systems. Trading signals are generated when the K value breaks through preset overbought/oversold levels (93⁄15) or the middle level (40). The system visually displays market conditions through color changes (red indicates potential decline, green indicates potential rise, blue indicates neutral). It also incorporates 20, 50, 100, and 200-period exponential moving averages (EMA) for trend confirmation. The strategy includes an intelligent risk management system supporting different risk-reward ratios such as 1:1, 1:4, and 1:8.
The strategy builds a comprehensive trading system by combining the Stochastic Oscillator, moving average system, and intelligent risk management. The strategy design emphasizes practicality and operability, suitable for traders with different risk preferences. Through continuous optimization and improvement, the strategy has the potential to maintain stable performance across different market conditions.
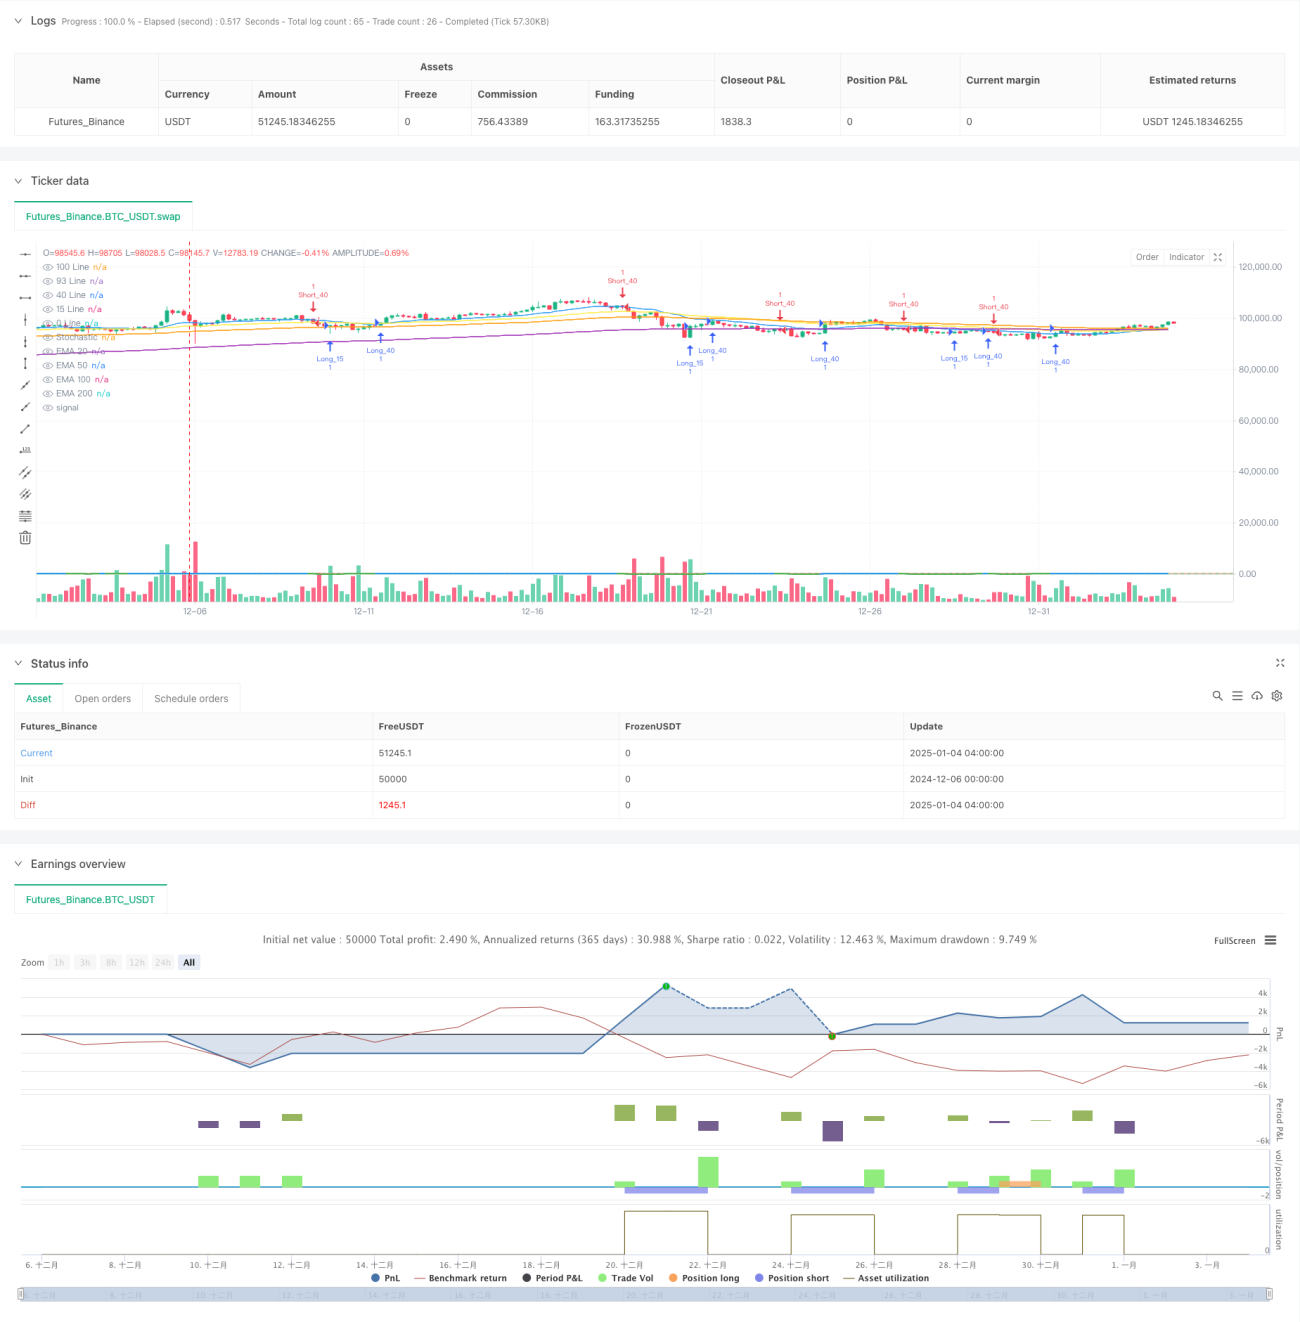
/*backtest
start: 2024-12-06 00:00:00
end: 2025-01-04 08:00:00
period: 4h
basePeriod: 4h
exchanges: [{"eid":"Futures_Binance","currency":"BTC_USDT"}]
*/
// This Pine Script™ code is subject to the terms of the Mozilla Public License 2.0 at https://mozilla.org/MPL/2.0/
// © petrusvorenusperegrinus
//██████╗ ███████╗████████╗██████╗ ██╗ ██╗███████╗
//██╔══██╗██╔════╝╚══██╔══╝██╔══██╗██║ ██║██╔════╝
//██████╔╝█████╗ ██║ ██████╔╝██║ ██║███████╗
//██╔═══╝ ██╔══╝ ██║ ██╔══██╗██║ ██║╚════██║
//██║ ███████╗ ██║ ██║ ██║╚██████╔╝███████║
//╚═╝ ╚══════╝ ╚═╝ ╚═╝ ╚═╝ ╚═════╝ ╚══════╝
//██╗ ██╗ ██████╗ ██████╗ ███████╗███╗ ██╗██╗ ██╗███████╗
//██║ ██║██╔═══██╗██╔══██╗██╔════╝████╗ ██║██║ ██║██╔════╝
//██║ ██║██║ ██║██████╔╝█████╗ ██╔██╗ ██║██║ ██║███████╗
//╚██╗ ██╔╝██║ ██║██╔══██╗██╔══╝ ██║╚██╗██║██║ ██║╚════██║
// ╚████╔╝ ╚██████╔╝██║ ██║███████╗██║ ╚████║╚██████╔╝███████║
// ╚═══╝ ╚═════╝ ╚═╝ ╚═╝╚══════╝╚═╝ ╚═══╝ ╚═════╝ ╚══════╝
//██████╗ ███████╗██████╗ ███████╗ ██████╗ ██████╗ ██╗███╗ ██╗██╗ ██╗███████╗
//██╔══██╗██╔════╝██╔══██╗██╔════╝██╔════╝ ██╔══██╗██║████╗ ██║██║ ██║██╔════╝
//██████╔╝█████╗ ██████╔╝█████╗ ██║ ███╗██████╔╝██║██╔██╗ ██║██║ ██║███████╗
//██╔═══╝ ██╔══╝ ██╔══██╗██╔══╝ ██║ ██║██╔══██╗██║██║╚██╗██║██║ ██║╚════██║
//██║ ███████╗██║ ██║███████╗╚██████╔╝██║ ██║██║██║ ╚████║╚██████╔╝███████║
//╚═╝ ╚══════╝╚═╝ ╚═╝╚══════╝ ╚═════╝ ╚═╝ ╚═╝╚═╝╚═╝ ╚═══╝ ╚═════╝ ╚══════╝
//@version=6
strategy("CM Stochastic POP Method 3", shorttitle="CM_Stochastic POP_M3", overlay=true)
// Stochastic Settings
length = input.int(14, "Stochastic Length", minval=1)
smoothK = input.int(5, "Smooth K", minval=1)
// Risk:Reward Settings
use_rr = input.bool(true, "Use Risk:Reward Ratio")
use_sl = input.bool(true, "Use Stop Loss") // New input for Stop Loss toggle
rr_options = input.string("1:1", "Risk:Reward Ratio", options=["1:1", "1:4", "1:8"])
stop_percent = input.float(1.0, "Stop Loss (%)", minval=0.1, step=0.1)
// Convert selected R:R ratio to number
get_rr_multiplier(rr) =>
switch rr
"1:1" => 1.0
"1:4" => 4.0
"1:8" => 8.0
=> 1.0 // default case
rr_ratio = get_rr_multiplier(rr_options)
// Fixed Level Settings
upperLine = 93.0 // Fixed sell level
midLine = 40.0 // Buy/Sell level
lowerLine = 15.0 // Fixed buy level
// EMA Settings
ema20 = ta.ema(close, 20)
ema50 = ta.ema(close, 50)
ema100 = ta.ema(close, 100)
ema200 = ta.ema(close, 200)
// Calculate Stochastic with smoothing
k = ta.sma(ta.stoch(close, high, low, length), smoothK)
// Dynamic color based on K value
kColor = k >= upperLine ? color.red : // Above 93 -> Red
k <= lowerLine ? color.green : // Below 15 -> Green
k <= midLine ? color.green : // Below 40 -> Green
color.blue // Between 40-93 -> Blue
// Buy Signals:
longCondition1 = ta.crossover(k, lowerLine) // Cross above 15
longCondition2 = ta.crossover(k, midLine) // Cross above 40
// Sell Signals:
shortCondition1 = ta.crossunder(k, upperLine) // Cross below 93
shortCondition2 = ta.crossunder(k, midLine) // Cross below 40
calc_tp_sl(entry_price, is_long) =>
sl_distance = entry_price * (stop_percent / 100)
sl = is_long ? entry_price - sl_distance : entry_price + sl_distance
tp_distance = sl_distance * rr_ratio
tp = is_long ? entry_price + tp_distance : entry_price - tp_distance
[sl, tp]
// Long entries
if (longCondition1)
if (use_rr)
[sl, tp] = calc_tp_sl(close, true)
strategy.entry("Long_15", strategy.long)
if (use_sl)
strategy.exit("Exit_15", "Long_15", stop=sl, limit=tp)
else
strategy.exit("Exit_15", "Long_15", limit=tp)
else
strategy.entry("Long_15", strategy.long)
if (longCondition2)
if (use_rr)
[sl, tp] = calc_tp_sl(close, true)
strategy.entry("Long_40", strategy.long)
if (use_sl)
strategy.exit("Exit_40", "Long_40", stop=sl, limit=tp)
else
strategy.exit("Exit_40", "Long_40", limit=tp)
else
strategy.entry("Long_40", strategy.long)
// Short entries
if (shortCondition1)
if (use_rr)
[sl, tp] = calc_tp_sl(close, false)
strategy.entry("Short_93", strategy.short)
if (use_sl)
strategy.exit("Exit_93", "Short_93", stop=sl, limit=tp)
else
strategy.exit("Exit_93", "Short_93", limit=tp)
else
strategy.entry("Short_93", strategy.short)
if (shortCondition2)
if (use_rr)
[sl, tp] = calc_tp_sl(close, false)
strategy.entry("Short_40", strategy.short)
if (use_sl)
strategy.exit("Exit_40", "Short_40", stop=sl, limit=tp)
else
strategy.exit("Exit_40", "Short_40", limit=tp)
else
strategy.entry("Short_40", strategy.short)
// Plot EMAs
plot(ema20, title="EMA 20", color=color.blue, linewidth=1, force_overlay = true)
plot(ema50, title="EMA 50", color=color.yellow, linewidth=1, force_overlay = true)
plot(ema100, title="EMA 100", color=color.orange, linewidth=1, force_overlay = true)
plot(ema200, title="EMA 200", color=color.purple, linewidth=1, force_overlay = true)
// Plot Stochastic line
plot(k, title="Stochastic", color=kColor, linewidth=2)
// Plot reference lines
hline(100, title="100 Line", color=color.white, linestyle=hline.style_solid)
hline(upperLine, title="93 Line", color=color.red, linestyle=hline.style_solid)
hline(midLine, title="40 Line", color=color.green, linestyle=hline.style_dashed)
hline(lowerLine, title="15 Line", color=color.green, linestyle=hline.style_solid)
hline(0, title="0 Line", color=color.white, linestyle=hline.style_solid)