Multi-Timeframe Quantitative Trading Strategy Based on EMA-Smoothed RSI and ATR Dynamic Stop-Loss/Take-Profit

Overview
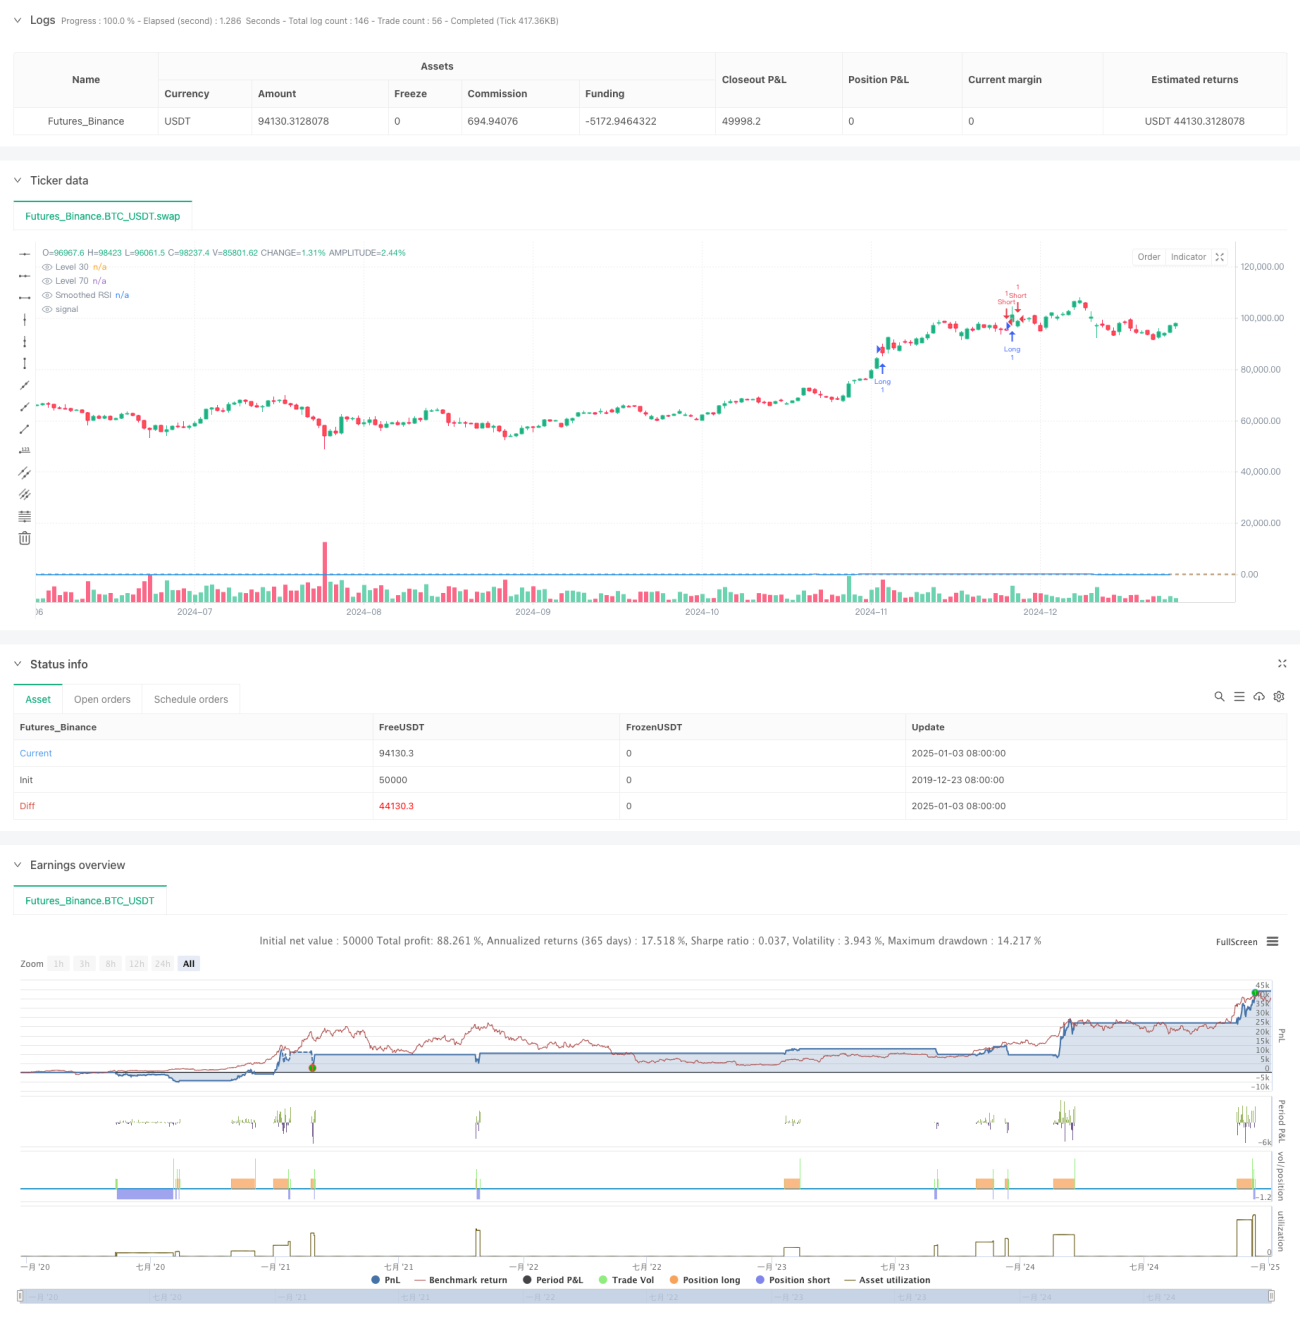
This strategy is a comprehensive quantitative trading system based on the Relative Strength Index (RSI), Exponential Moving Average (EMA), and Average True Range (ATR). The strategy smooths RSI using EMA, triggers trades through RSI breakouts at key levels, and utilizes ATR for dynamic stop-loss and take-profit levels to achieve effective risk control. Additionally, the strategy includes trade signal counting and recording functions to assist traders in backtesting and optimization.
Strategy Principle
The core logic includes the following key components:
- Uses 14-period RSI to calculate market overbought/oversold conditions
- Smooths RSI through EMA to reduce false signals
- Generates trading signals when RSI breaks through key levels of 70 and 30
- Uses ATR for dynamic calculation of stop-loss and take-profit levels
- Establishes a trade signal counting table to record price information for each trade
Strategy Advantages
- Strong Signal Smoothing: RSI smoothing through EMA effectively reduces false breakout signals
- Comprehensive Risk Control: Dynamic stop-loss using ATR adapts to market volatility
- Bi-directional Trading: Supports both long and short trading to capture market opportunities
- Parameter Adjustability: Key parameters can be customized for different market characteristics
- Visual Monitoring: Records trading signals in a table for strategy monitoring and backtesting
Strategy Risks
- RSI False Breakout Risk: Even with EMA smoothing, RSI may still generate false breakout signals
- ATR Stop-Loss Inadequacy: Improper ATR multiplier settings may lead to loose or tight stops
- Parameter Optimization Risk: Over-optimization may result in strategy overfitting
- Market Environment Dependency: Performance may vary significantly between trending and ranging markets
Strategy Optimization
- Introduce Multi-timeframe Analysis: Incorporate longer timeframe RSI signals for trade confirmation
- Optimize Stop-Loss Mechanism: Consider dynamic ATR multiplier adjustment based on support/resistance
- Add Market Environment Analysis: Include trend indicators to adjust strategy parameters
- Improve Signal Filtering: Consider adding volume indicators to filter false breakouts
- Implement Position Sizing: Dynamically adjust position size based on signal strength and volatility
Summary
The strategy combines three classic technical indicators - RSI, EMA, and ATR - to build a complete quantitative trading system. It demonstrates strong practicality in signal generation, risk control, and trade execution. Through continuous optimization and improvement, the strategy shows promise for stable performance in live trading. However, users need to consider the impact of market conditions on strategy performance, set parameters appropriately, and maintain proper risk control.
/*backtest
start: 2019-12-23 08:00:00
end: 2025-01-04 08:00:00
period: 1d
basePeriod: 1d
exchanges: [{"eid":"Futures_Binance","currency":"BTC_USDT"}]
*/

//@version=6
strategy("RSI Trading Strategy with EMA and ATR Stop Loss/Take Profit", overlay=true)
length = input.int(14, minval=1, title="RSI Length")
src = input(close, title="Source")- 1