Multi-Technical Indicator Fusion Trend Following Quantitative Trading Strategy

Overview
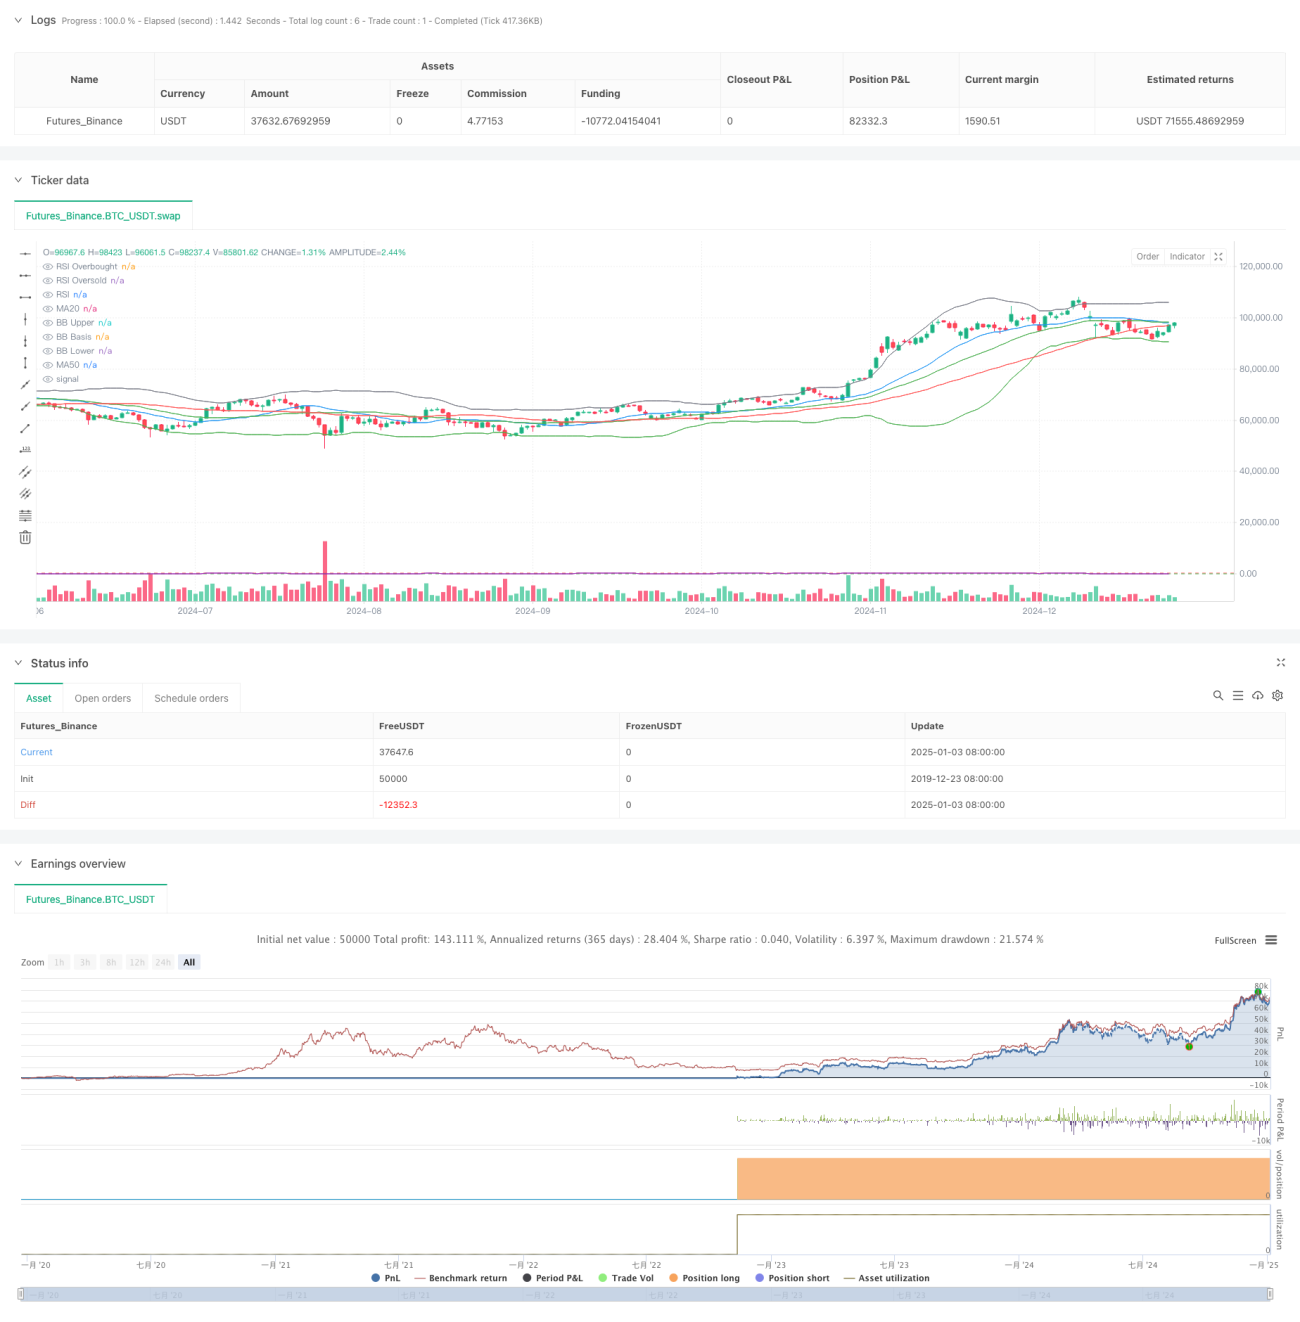
This strategy is a quantitative trading system that integrates three major technical indicators: Relative Strength Index (RSI), Moving Average (MA), and Bollinger Bands (BB). The strategy seeks optimal trading opportunities in market trends and volatility by comprehensively analyzing signals from multiple technical indicators. It uses MA20 and MA50 crossovers to judge medium-term trends, combined with RSI overbought/oversold signals and Bollinger Bands breakout/regression to build a complete trading decision system.
Strategy Principles
The core logic is based on three dimensions:
- Trend Judgment: Uses MA20 and MA50 crossover relationships to determine market medium-term trends, with MA20 crossing above MA50 indicating an uptrend, and vice versa.
- Momentum Judgment: Uses RSI indicator to judge market overbought/oversold conditions, with RSI below 25 entering oversold territory and above 80 entering overbought territory.
- Volatility Judgment: Uses Bollinger Bands (BB30) channels to map price volatility ranges, with lower band breakout indicating oversold conditions and upper band breakout indicating overbought conditions.
Long conditions must simultaneously satisfy: RSI<25(oversold)+MA20>MA50(uptrend)+price<BB lower band(oversold)
Short conditions must simultaneously satisfy: RSI>80(overbought)+MA20<MA50(downtrend)+price>BB upper band(overbought)
Strategy Advantages
- Multi-indicator Cross-validation: Improves trading signal reliability by integrating indicators from trend, momentum, and volatility dimensions.
- Comprehensive Risk Control: Reasonable RSI overbought/oversold thresholds effectively filter false signals.
- Strong Adaptability: Bollinger Bands self-adjust based on market volatility, improving strategy performance in different market environments.
- Strong Parameter Adjustability: Key indicator parameters can be optimized for different market characteristics.
Strategy Risks
- Lag Risk: Moving averages have inherent lag, potentially causing delayed entry timing.
- Oscillation Risk: May generate frequent false signals in sideways markets.
- Trend Reversal Risk: Strategy may not respond quickly enough to sudden trend reversals.
- Parameter Sensitivity: Over-optimization of parameters may lead to overfitting issues.
Strategy Optimization Directions
- Incorporate Volume Indicators: Recommend adding volume analysis dimension to improve trend judgment accuracy.
- Optimize Stop-loss Mechanism: Design dynamic stop-loss based on ATR to enhance risk control capability.
- Add Market Environment Filters: Include market volatility judgment to adjust strategy parameters in high volatility environments.
- Improve Position Management: Design dynamic position control system based on signal strength.
Summary
The strategy constructs a relatively complete trading system through the synergistic combination of multiple technical indicators. It performs excellently in markets with clear trends but requires attention to market environment changes and corresponding adjustments. Through continuous optimization and improvement, the strategy has the potential to achieve stable returns in live trading.
- 1