Long-term Trend SMA Crossover Quantitative Strategy

Overview
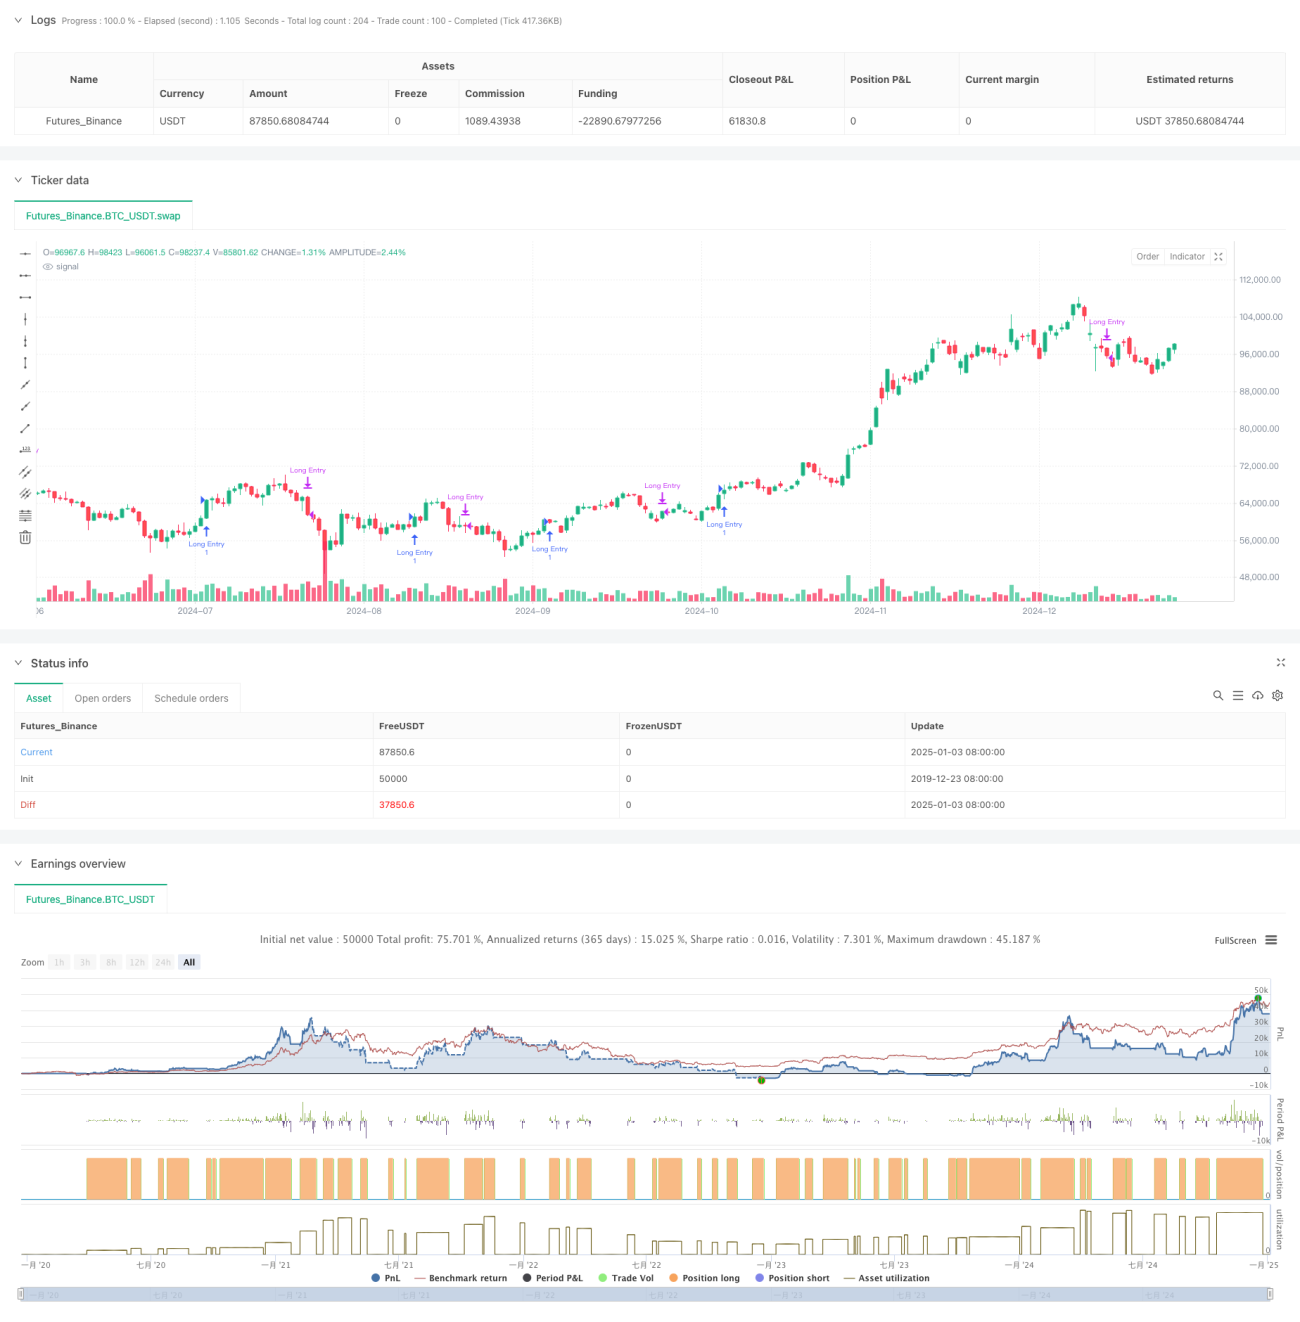
This strategy is a quantitative trading system based on multi-period Simple Moving Average (SMA) crossover signals. It primarily identifies pullback opportunities within long-term uptrends. The strategy utilizes SMAs of five different periods (5, 10, 20, 60, and 120 days) to determine market trends and trading opportunities through their relative positions and crossover signals.
Strategy Principles
The core logic includes several key components:
- Long-term trend identification through the relative position of SMA20 and SMA60, confirming an uptrend when SMA20 is above SMA60.
- Buy signals are triggered when the short-term SMA5 crosses above SMA20 after a pullback, indicating a rebound within the uptrend.
- Exit signals occur when SMA20 crosses above SMA5, suggesting weakening short-term momentum.
- The strategy includes a time filter functionality to limit backtesting periods, enhancing flexibility.
Strategy Advantages
- Clear and simple logic that is easy to understand and implement, avoiding complex calculations.
- Effective noise filtering through the use of multiple period moving averages, improving signal reliability.
- Focus on pullback opportunities within trending markets, aligning with core trend-following principles.
- Use of SMA instead of EMA reduces price sensitivity and false signals.
- Clear entry and exit logic facilitates execution and risk management.
Strategy Risks
- Inherent lag in moving average systems may lead to suboptimal entry and exit timing.
- Frequent crossovers in ranging markets may generate excessive false signals.
- Lack of volatility filtering mechanism exposes the strategy to significant drawdown risk in high volatility periods.
- Reliability of signals may be compromised without volume confirmation.
- Fixed moving average parameters may not suit all market conditions.
Optimization Directions
- Implement ATR indicator for volatility filtering to avoid trading in high volatility periods.
- Incorporate volume confirmation mechanism to enhance signal reliability.
- Develop adaptive moving average periods to better suit different market environments.
- Add trend strength filters, such as ADX indicator, to ensure trading in strong trends only.
- Enhance stop-loss mechanisms, including trailing stops, for better risk control.
Summary
The strategy builds a trading system focused on capturing pullback opportunities within long-term uptrends through the coordinated use of multiple-period SMAs. Its design is practical and straightforward, offering good comprehensibility and executability. The strategy's robustness and reliability can be further enhanced through the introduction of volatility filtering, volume confirmation, and other optimization measures.
/*backtest
start: 2019-12-23 08:00:00
end: 2025-01-04 08:00:00
period: 1d
basePeriod: 1d
exchanges: [{"eid":"Futures_Binance","currency":"BTC_USDT"}]
*/

//@version=6
strategy("Long-Term Growing Stock Strategy", overlay=true)
// Date Range
// STEP 1. Create inputs that configure the backtest's date range- 1