Dual Timeframe Trend Reversal Candlestick Pattern Quantitative Trading Strategy

Overview
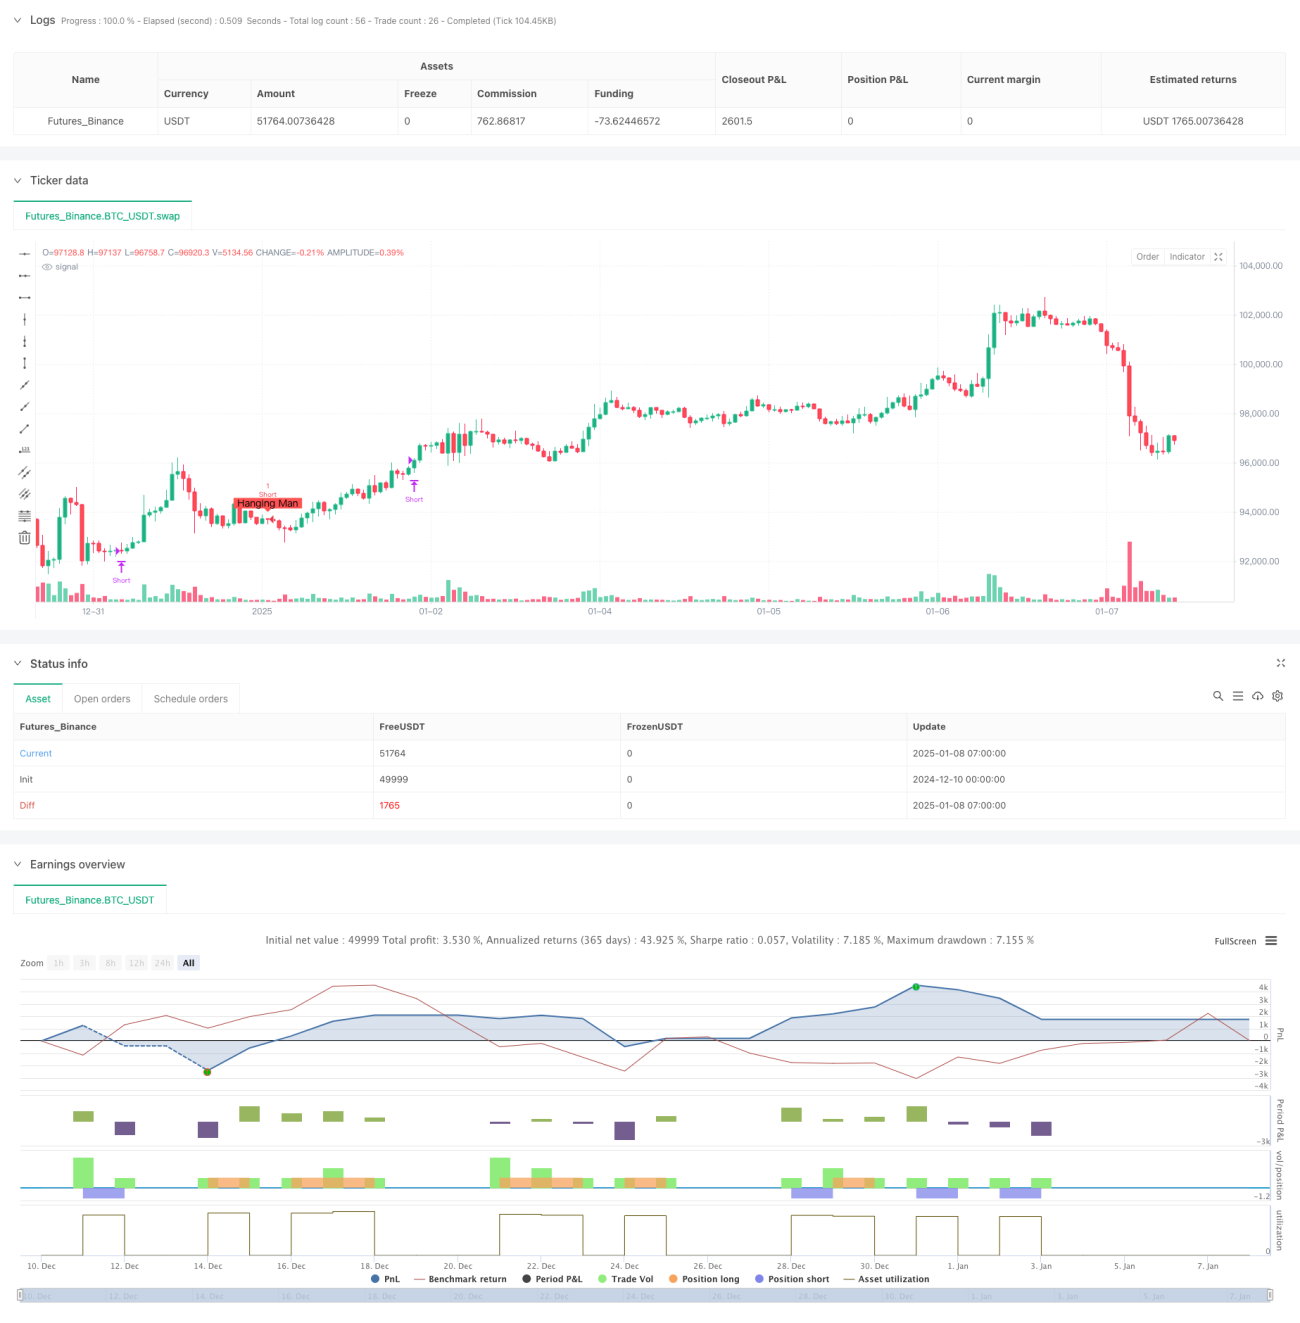
This strategy is a quantitative trading system based on two classic candlestick patterns: Hammer and Hanging Man. It predicts potential market turning points by identifying these reversal patterns. The system combines multiple technical indicators to confirm signal validity, including the relationship between candlestick body and shadows, trend direction, and other elements, achieving precise capture of market reversal points.
Strategy Principle
The core logic of the strategy is to identify two key candlestick patterns programmatically:
- Hammer: Appears in downtrends, suggesting potential upward reversal. Characterized by a small body, long lower shadow (at least twice the body length), and minimal or no upper shadow.
- Hanging Man: Appears in uptrends, suggesting potential downward reversal. Similar characteristics to Hammer but appears in different locations with opposite implications.
The strategy quantifies these patterns through strict parameters, including:
- Minimum candle body length multiplier
- Lower shadow to candle height ratio
- Holding periods
Strategy Advantages
- Systematic Identification: Precisely identifies market reversal signals programmatically, avoiding subjective human judgment.
- Controlled Risk: Sets clear holding periods, avoiding risks from excessive position holding.
- Signal Visualization: Displays trading signals intuitively on charts for analysis and optimization.
- Flexible Parameters: Can adjust parameters based on different market conditions, improving strategy adaptability.
Strategy Risks
- False Breakout Risk: Reversal patterns may generate false signals, requiring confirmation from other technical indicators.
- Timing Risk: Fixed holding periods may not fully capture price movement potential.
- Market Environment Dependency: May generate excessive false signals in ranging markets.
Strategy Optimization Directions
- Introduce Trend Filters: Add indicators like moving averages to filter trends and improve signal quality.
- Dynamic Holding Periods: Adjust holding time based on market volatility.
- Multi-timeframe Confirmation: Implement higher timeframe trend confirmation mechanisms.
- Stop Loss Optimization: Add dynamic stop loss mechanisms to improve risk control.
Summary
This strategy implements classical technical analysis theory systematically through quantification, demonstrating strong practical value. Through parameter optimization and risk control mechanism refinement, the strategy can maintain stable performance in different market environments. The modular design also provides a solid foundation for subsequent optimization.
- 1