Multi-Dimensional Trend Following Pyramid Trading Strategy

Overview
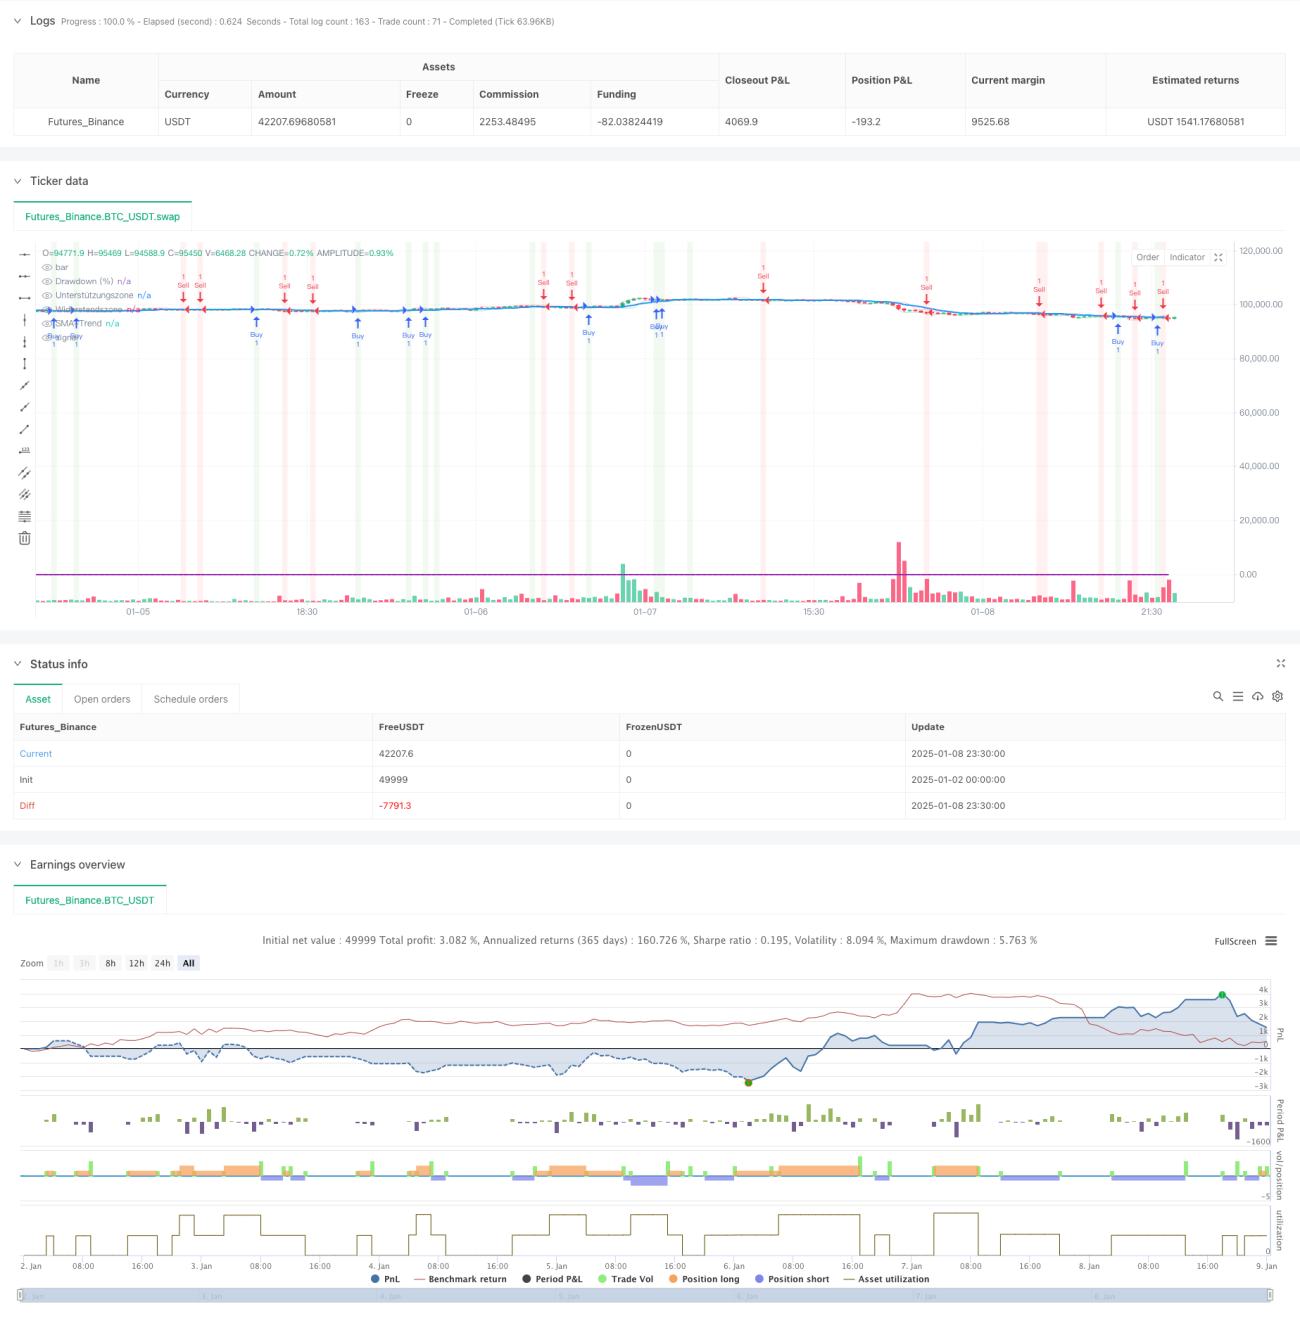
This is a quantitative trading strategy based on the Markttechnik (MT) analysis method widely used by German financial institutions. The strategy combines multiple dimensions including SMA trend following, support and resistance identification, reversal candlestick pattern analysis, and pyramid position sizing, achieving stable trading through strict risk control. The core of the strategy lies in determining market trend direction through multi-dimensional signal synthesis and expanding profits through pyramid position sizing when trends form.
Strategy Principles
The strategy employs the following key components to build the trading system:
- Trend Determination: Uses 10-period Simple Moving Average (SMA) as the main trend indicator, with prices above SMA indicating uptrend and vice versa.
- Support and Resistance: Determines short-term support and resistance zones using 3-period high and low prices.
- Reversal Patterns: Analyzes hammer and shooting star candlestick patterns as important reversal indicators.
- Trading Signals: Triggers trading signals based on trend direction confirmation combined with support/resistance levels and reversal patterns.
- Position Management: Employs pyramid position sizing strategy allowing up to 2x position accumulation.
- Risk Control: Sets 5% maximum drawdown limit and uses 2.0 risk-reward ratio for stop loss and take profit levels.
Strategy Advantages
- Multi-dimensional Signal Confirmation: Improves trading accuracy through comprehensive analysis of signals from trend, support/resistance, and candlestick patterns.
- Pyramid Position Sizing: Allows profit expansion through position accumulation during trend continuation.
- Strict Risk Control: Controls risk through maximum drawdown limits and fixed risk-reward ratio.
- Visualization Support: Provides complete graphical display including support/resistance zones, trend lines, and signal backgrounds.
- Flexible Parameter Settings: Key parameters can be adjusted according to different market conditions.
Strategy Risks
- Trend Reversal Risk: Consecutive losses may occur during sudden trend reversals.
- False Breakout Risk: Market may generate false support/resistance breakout signals.
- Parameter Sensitivity: Strategy performance is sensitive to parameter settings, requiring different combinations for different market environments.
- Slippage Impact: Actual execution prices may significantly deviate from signal prices during high market volatility.
- Position Sizing Risk: Pyramid position sizing may amplify losses during extreme market volatility.
Strategy Optimization Directions
- Dynamic Parameter Optimization: Introduce adaptive parameter adjustment mechanism based on market volatility conditions.
- Market Environment Classification: Add market environment recognition module to apply different parameter combinations under different market conditions.
- Stop Loss Optimization: Introduce trailing stop mechanism to better protect existing profits.
- Position Sizing Condition Refinement: Optimize position sizing conditions based on volatility, volume, and other factors.
- Signal Filtering: Add volume, volatility, and other filtering conditions to improve signal quality.
Summary
This strategy constructs a complete trading system through multi-dimensional signal analysis and strict risk control. The core advantages lie in signal reliability and risk controllability, though parameter optimization is still needed for different market environments. Through the suggested optimization directions, strategy stability and profitability can be further improved. The strategy is suitable for markets with clear trends and is a worthwhile consideration for traders seeking stable returns.
- 1