
Overview
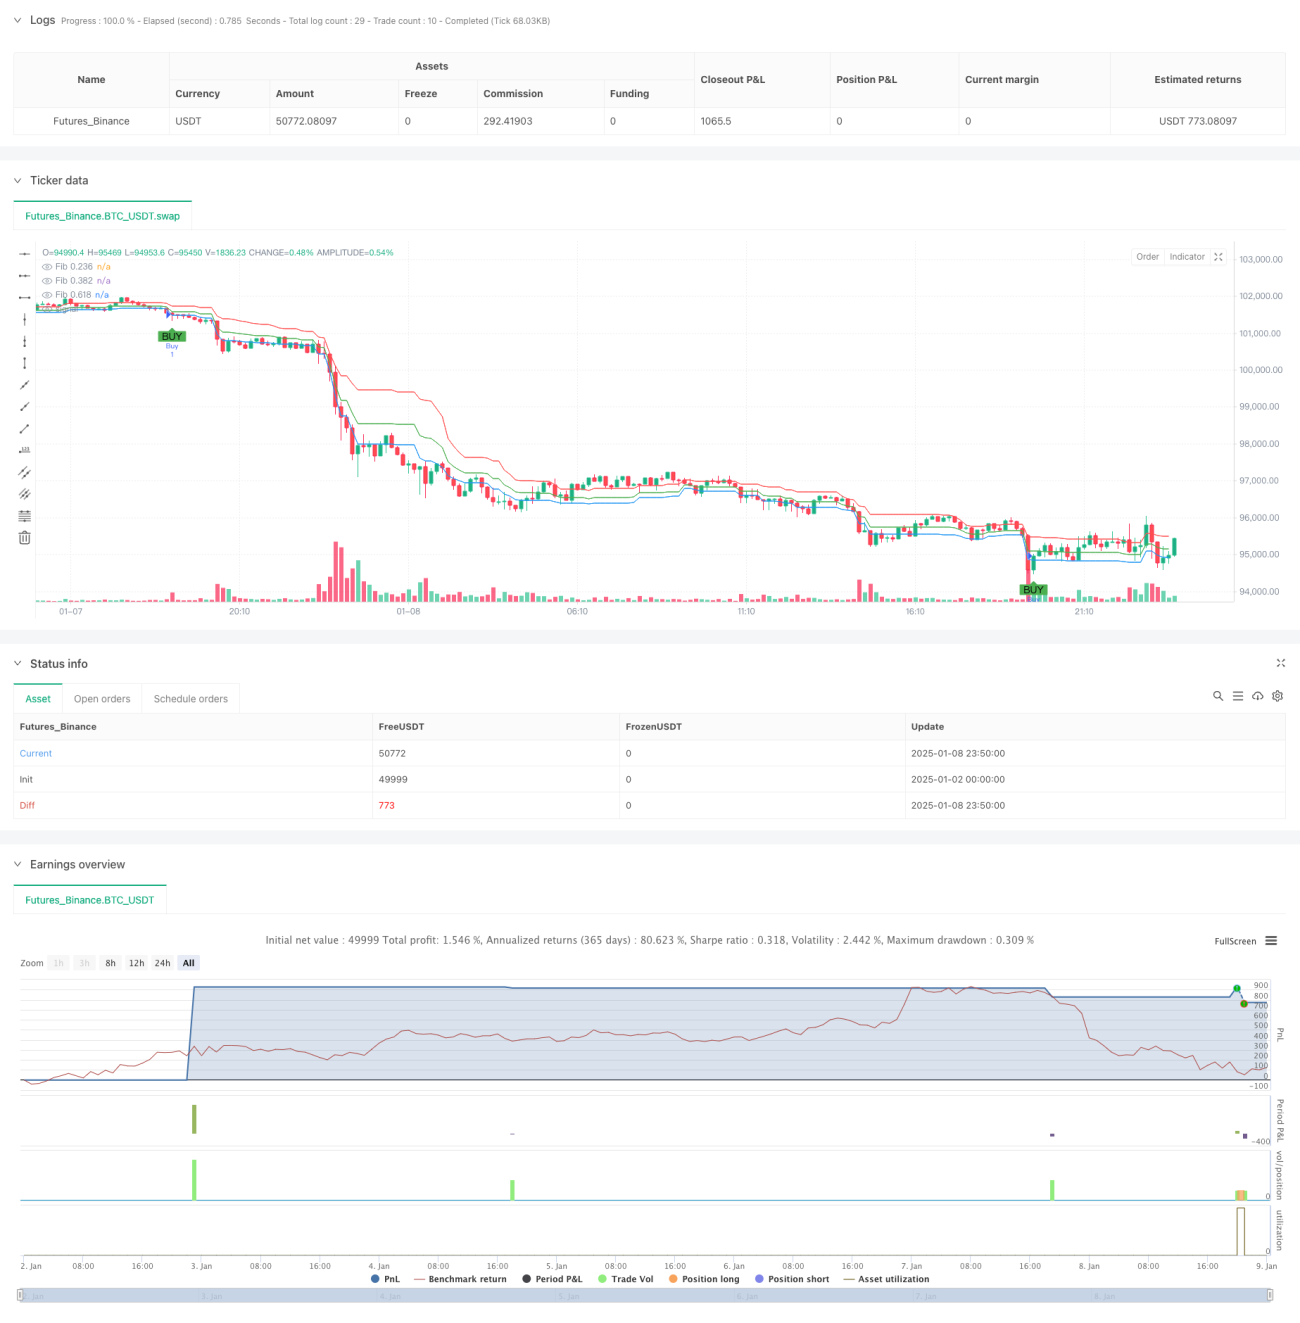
This strategy is an intraday trading system that combines Bollinger Bands and Fibonacci retracement levels. It identifies overbought and oversold conditions using Bollinger Bands while utilizing Fibonacci retracement levels to confirm potential support and resistance zones, thereby capturing trading opportunities in market fluctuations. The strategy employs Bollinger Bands based on a 20-period window and three key Fibonacci levels: 0.236, 0.382, and 0.618.
Strategy Principles
The core logic of the strategy is based on the following key elements:
- Using Bollinger Bands (2 standard deviations) to identify overbought and oversold price zones
- Calculating Fibonacci retracement levels based on the highest and lowest prices of the last 20 periods
- Generating buy signals when price breaks below the lower Bollinger Band and remains above the Fibonacci 0.236 or 0.382 support levels
- Generating sell signals when price breaks above the upper Bollinger Band and remains below the Fibonacci 0.618 resistance level
- Using fixed stop-loss and take-profit points to control risk and secure profits
Strategy Advantages
- Combines trend and support/resistance confirmation mechanisms, improving signal reliability
- Bollinger Bands dynamically adapt to changes in market volatility, providing good strategy adaptability
- Fibonacci levels provide a clear reference framework for entries and exits
- Fixed stop-loss and take-profit settings help maintain strict risk control
- Strategy parameters can be flexibly adjusted for different market conditions
Strategy Risks
- May generate frequent false breakout signals in ranging markets
- Fixed stop-loss and take-profit settings may not suit all market environments
- Effectiveness of Fibonacci levels is heavily influenced by market structure
- May miss some opportunities in rapidly trending markets
- Requires continuous monitoring and parameter adjustment to adapt to market changes
Strategy Optimization Directions
- Introduce volume indicators to confirm breakout validity
- Dynamically adjust stop-loss and take-profit levels based on market volatility
- Add trend filters to avoid trading in ranging markets
- Optimize the calculation period for Fibonacci levels
- Consider adding time filters to avoid trading during low liquidity periods
Summary
This is a complete trading system combining classic technical analysis tools, providing traders with a systematic trading framework through the synergy of Bollinger Bands and Fibonacci retracements. While it has certain limitations, the strategy can perform well in intraday trading through appropriate parameter optimization and risk management. The key is to make corresponding adjustments and optimizations based on specific trading instruments and market conditions.
- 1