Optimized Dual T3 Trend Tracking Strategy

T3 TOTT EMA OTT RSI
Created on: 2025-01-17 14:29:51 Modified on: 2025-01-17 14:29:51
Copy: 2 Number of hits: 368
avatar of ChaoZhang ChaoZhang
1
Follow
1617
Followers

 Optimized Dual T3 Trend Tracking Strategy

Overview

This strategy is a trend following system based on the Tillson T3 indicator and Twin Optimized Trend Tracker (TOTT). It optimizes trade signal generation by incorporating the Williams %R momentum oscillator. The strategy employs separate buy and sell parameter settings, enabling flexible sensitivity adjustment for different market conditions.

Strategy Principles

The strategy consists of three core components: 1. 
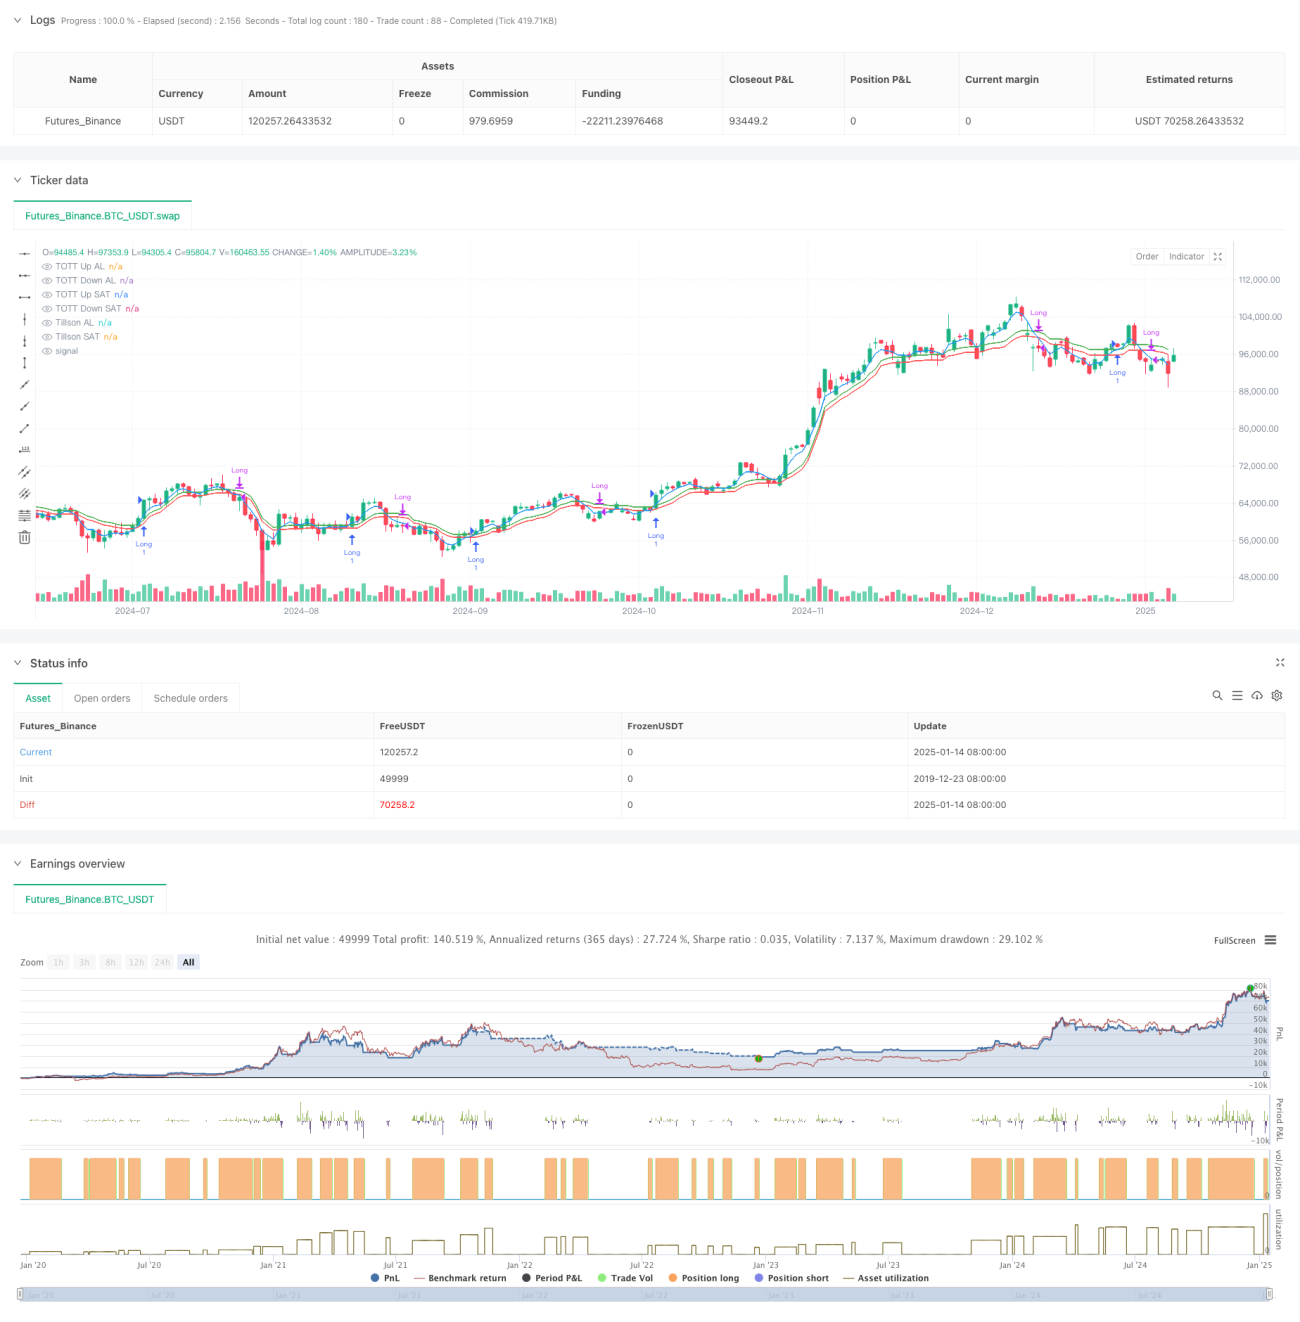
Tillson T3 Indicator - An optimized variant of the Exponential Moving Average (EMA) that produces a smoother trend line through multiple weighted EMA calculations. 2. Twin Optimized Trend Tracker (TOTT) - An adaptive trend following tool that adjusts based on price action and volatility coefficient, calculating upper and lower bands for buy and sell conditions. 3. Williams %R Indicator - A momentum oscillator used to identify overbought and oversold conditions.

Signal generation logic: - Buy condition: When T3 line crosses above TOTT upper band and Williams %R is above -20 (oversold) - Sell condition: When T3 line crosses below TOTT lower band and Williams %R is above -70

Strategy Advantages

  1. Strong signal stability - Effectively reduces false breakout risks through T3’s multiple smoothing
  2. Good adaptability - Separate buy/sell parameters allow independent optimization for different market conditions
  3. Comprehensive risk control - Integrates Williams %R as secondary confirmation
  4. Clear visualization - Provides comprehensive chart visualization support

Strategy Risks

  1. Trend reversal lag - T3’s multiple smoothing may cause signal delays
  2. Unsuitable for ranging markets - May generate excessive signals during consolidation
  3. High parameter sensitivity - Requires frequent adjustment for different market environments

Risk control suggestions: - Implement stop-loss mechanisms - Set trading volume limits - Add trend confirmation filters

Optimization Directions

  1. Dynamic parameter optimization - Develop adaptive parameter adjustment mechanisms
  2. Enhanced market environment recognition - Introduce trend strength indicators
  3. Improved risk management - Add dynamic stop-loss and take-profit
  4. Enhanced signal filtering - Integrate additional technical indicators

Summary

This is a well-structured trend following strategy with clear logic. Through the combination of T3 indicator and TOTT, coupled with Williams %R filtering, it performs excellently in trending markets. While there is some inherent lag, the strategy shows good practical value and room for expansion through parameter optimization and risk management improvements.

Strategy source code
/*backtest
start: 2019-12-23 08:00:00
end: 2025-01-15 08:00:00
period: 1d
basePeriod: 1d
exchanges: [{"eid":"Futures_Binance","currency":"BTC_USDT","balance":49999}]
*/

//@version=6
strategy("FON60DK by leventsah", overlay=true)

// Girdi AL
t3_length = input.int(5, title="Tillson Per AL", minval=1)
t3_opt = input.float(0.1, title="Tillson Opt AL", step=0.1, minval=0)
tott_length = input.int(5, title="TOTT Per AL", minval=1)
tott_opt = input.float(0.1, title="TOTT Opt AL", step=0.1, minval=0)
tott_coeff = input.float(0.006, title="TOTT Coeff AL", step=0.001, minval=0)

//GİRDİ SAT
t3_lengthSAT = input.int(5, title="Tillson Per SAT", minval=1)
t3_optSAT = input.float(0.1, title="Tillson Opt SAT", step=0.1, minval=0)
tott_lengthSAT = input.int(5, title="TOTT Per SAT", minval=1)
tott_opt_SAT = input.float(0.1, title="TOTT Opt SAT", step=0.1, minval=0)
tott_coeff_SAT = input.float(0.006, title="TOTT Coeff SAT", step=0.001, minval=0)

william_length = input.int(3, title="William %R Periyodu", minval=1)

// Tillson T3 AL
t3(src, length, opt) =>
    k = 2 / (length + 1)
    ema1 = ta.ema(src, length)
    ema2 = ta.ema(ema1, length)
    ema3 = ta.ema(ema2, length)
    ema4 = ta.ema(ema3, length)
    c1 = -opt * opt * opt
    c2 = 3 * opt * opt + 3 * opt * opt * opt
    c3 = -6 * opt * opt - 3 * opt - 3 * opt * opt * opt
    c4 = 1 + 3 * opt + opt * opt * opt + 3 * opt * opt
    t3_val = c1 * ema4 + c2 * ema3 + c3 * ema2 + c4 * ema1
    t3_val

t3_value = t3(close, t3_length, t3_opt)
t3_valueSAT = t3(close, t3_lengthSAT, t3_optSAT)


// TOTT hesaplaması (Twin Optimized Trend Tracker)
Var_Func(src, length) =>
    valpha = 2 / (length + 1)
    vud1 = math.max(src - src[1], 0)
    vdd1 = math.max(src[1] - src, 0)
    vUD = math.sum(vud1, 9)
    vDD = math.sum(vdd1, 9)
    vCMO = (vUD - vDD) / (vUD + vDD)
    var float VAR = na
    VAR := valpha * math.abs(vCMO) * src + (1 - valpha * math.abs(vCMO)) * nz(VAR[1], src)
    VAR

VAR = Var_Func(close, tott_length)
VAR_SAT = Var_Func(close, tott_lengthSAT)

//LONG 
MAvg = VAR
fark = MAvg * tott_opt * 0.01
longStop = MAvg - fark
longStopPrev = nz(longStop[1], longStop)
longStop := MAvg > longStopPrev ? math.max(longStop, longStopPrev) : longStop
shortStop = MAvg + fark
shortStopPrev = nz(shortStop[1], shortStop)
shortStop := MAvg < shortStopPrev ? math.min(shortStop, shortStopPrev) : shortStop
dir = 1
dir := nz(dir[1], dir)
dir := dir == -1 and MAvg > shortStopPrev ? 1 : dir == 1 and MAvg < longStopPrev ? -1 : dir
MT = dir == 1 ? longStop : shortStop
OTT = MAvg > MT ? MT * (200 + tott_opt) / 200 : MT * (200 - tott_opt) / 200
OTTup = OTT * (1 + tott_coeff)
OTTdn = OTT * (1 - tott_coeff)

//CLOSE
MAvgS = VAR_SAT
farkS = MAvgS * tott_opt_SAT * 0.01
longStopS = MAvgS - farkS
longStopPrevS = nz(longStopS[1], longStopS)
longStopS := MAvgS > longStopPrevS ? math.max(longStopS, longStopPrevS) : longStopS
shortStopS = MAvgS + farkS
shortStopPrevS = nz(shortStopS[1], shortStopS)
shortStopS := MAvgS < shortStopPrevS ? math.min(shortStopS, shortStopPrevS) : shortStopS
dirS = 1
dirS := nz(dirS[1], dirS)
dirS := dirS == -1 and MAvgS > shortStopPrevS ? 1 : dirS == 1 and MAvgS < longStopPrevS ? -1 : dirS
MTS = dirS == 1 ? longStopS : shortStopS
OTTS = MAvgS > MTS ? MTS * (200 + tott_opt_SAT) / 200 : MTS * (200 - tott_opt_SAT) / 200
OTTupS = OTTS * (1 + tott_coeff_SAT)
OTTdnS = OTTS * (1 - tott_coeff_SAT)

// Calculation of Williams %R
williamsR = -100 * (ta.highest(high, william_length) - close) / (ta.highest(high, william_length) - ta.lowest(low, william_length))

// Alım koşulu
longCondition = (t3_value > OTTup) and (williamsR > -20)

// Short koşulu (long pozisyonunu kapatmak için)
shortCondition = (t3_valueSAT < OTTdnS) and (williamsR > -70)

// Alım pozisyonu açma
if (longCondition)
    strategy.entry("Long", strategy.long)

// Short koşulu sağlandığında long pozisyonunu kapama
if (shortCondition)
    strategy.close("Long")


// Alım pozisyonu boyunca barları yeşil yapma
barcolor(strategy.position_size > 0 ? color.green : na)

// Grafikte göstergeleri çizme
plot(t3_value, color=color.blue, linewidth=1, title="Tillson AL")
plot(OTTup, color=color.green, linewidth=1, title="TOTT Up AL")
plot(OTTdn, color=color.red, linewidth=1, title="TOTT Down AL")

// Grafikte göstergeleri çizme
plot(t3_valueSAT, color=color.blue, linewidth=1, title="Tillson SAT")
plot(OTTupS, color=color.green, linewidth=1, title="TOTT Up SAT")
plot(OTTdnS, color=color.red, linewidth=1, title="TOTT Down SAT")