
Overview
This is a comprehensive quantitative trading strategy that combines WaveTrend indicator, Fibonacci retracement levels, and RSI indicator. The strategy seeks optimal trading opportunities in market trends and price fluctuations through the coordination of multiple technical indicators. It continuously tracks market trends through dynamic adjustment and improves trading accuracy through multiple signal confirmations.
Strategy Principle
The strategy is based on several core elements:
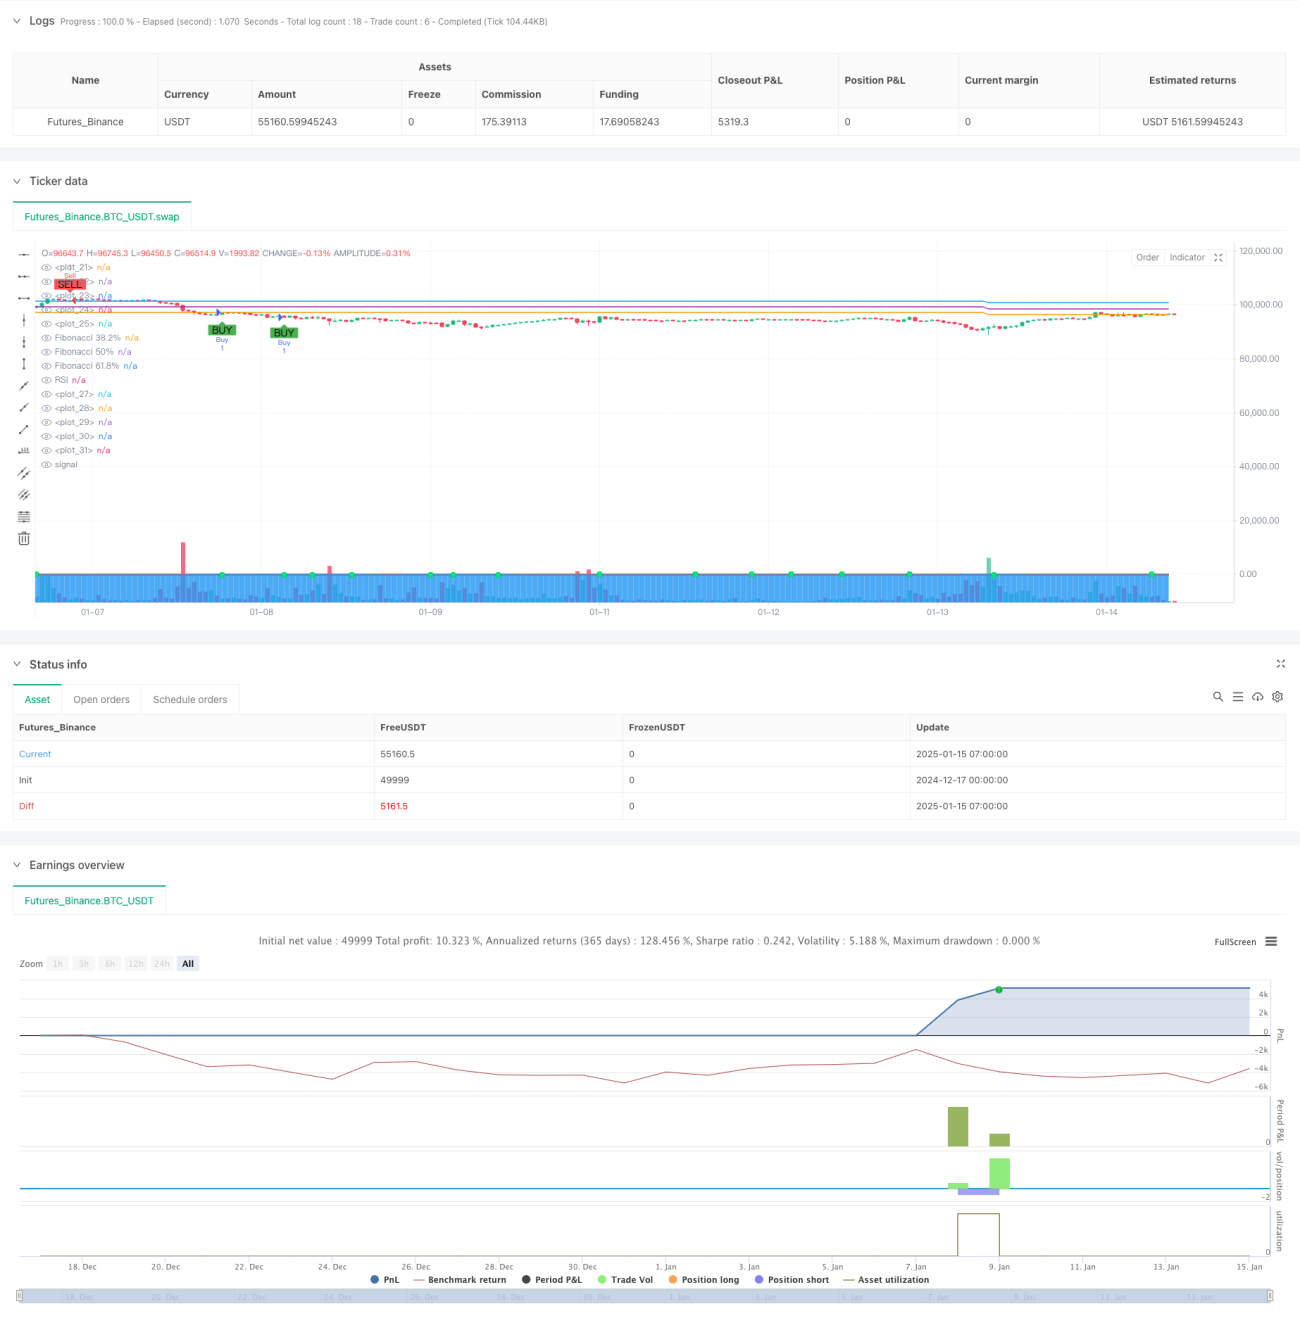
- WaveTrend indicator: Constructs a dynamic volatility channel by calculating the exponential moving average (EMA) and standard deviation of prices. Trading signals are generated when the fast line (WT1) crosses the slow line (WT2).
- Fibonacci retracement levels: The strategy dynamically calculates and updates price highs and lows, drawing three key Fibonacci retracement levels at 38.2%, 50%, and 61.8%.
- RSI indicator: Uses a 14-period Relative Strength Index (RSI) to confirm market overbought and oversold conditions.
- Multiple signal confirmation: The strategy requires simultaneous satisfaction of specific conditions including WaveTrend crossover signals, RSI overbought/oversold signals, and price relationship with Fibonacci levels.
Strategy Advantages
- High signal reliability: Effectively reduces the impact of false signals through the coordination of multiple technical indicators.
- Comprehensive risk control: Implements a point-based stop-loss and take-profit mechanism to effectively control risk for each trade.
- Strong adaptability: Strategy can dynamically adjust Fibonacci levels to adapt to different market environments.
- Clear signals: Trading signals are clear, easy to understand and execute.
Strategy Risks
- Market volatility risk: Stop-loss points may become too loose in severely volatile markets.
- Signal lag: Due to the use of moving averages and other technical indicators, signals may have some lag.
- Money management risk: Fixed stop-loss and take-profit levels may not be suitable for all market environments.
Strategy Optimization Directions
- Dynamic stop-loss and take-profit: Suggest changing fixed point stop-loss and take-profit to dynamic mechanism based on ATR indicator.
- Market environment filtering: Add trend strength filter to adjust strategy parameters in different market environments.
- Signal optimization: Consider adding volume indicators to assist in confirming trading signals.
- Parameter optimization: Recommend optimizing WaveTrend and RSI parameters to adapt to different trading instruments and timeframes.
Summary
This is a well-designed quantitative trading strategy with clear logic. Through the combined use of multiple technical indicators, it can effectively capture market opportunities while controlling risks. The strategy's main advantages lie in its reliable signal system and comprehensive risk control mechanism. Through the suggested optimization directions, the strategy's stability and adaptability can be further enhanced.
- 1