Quantitative Momentum Trading VWAP-MACD Dual Indicator Trend Following Strategy

Overview
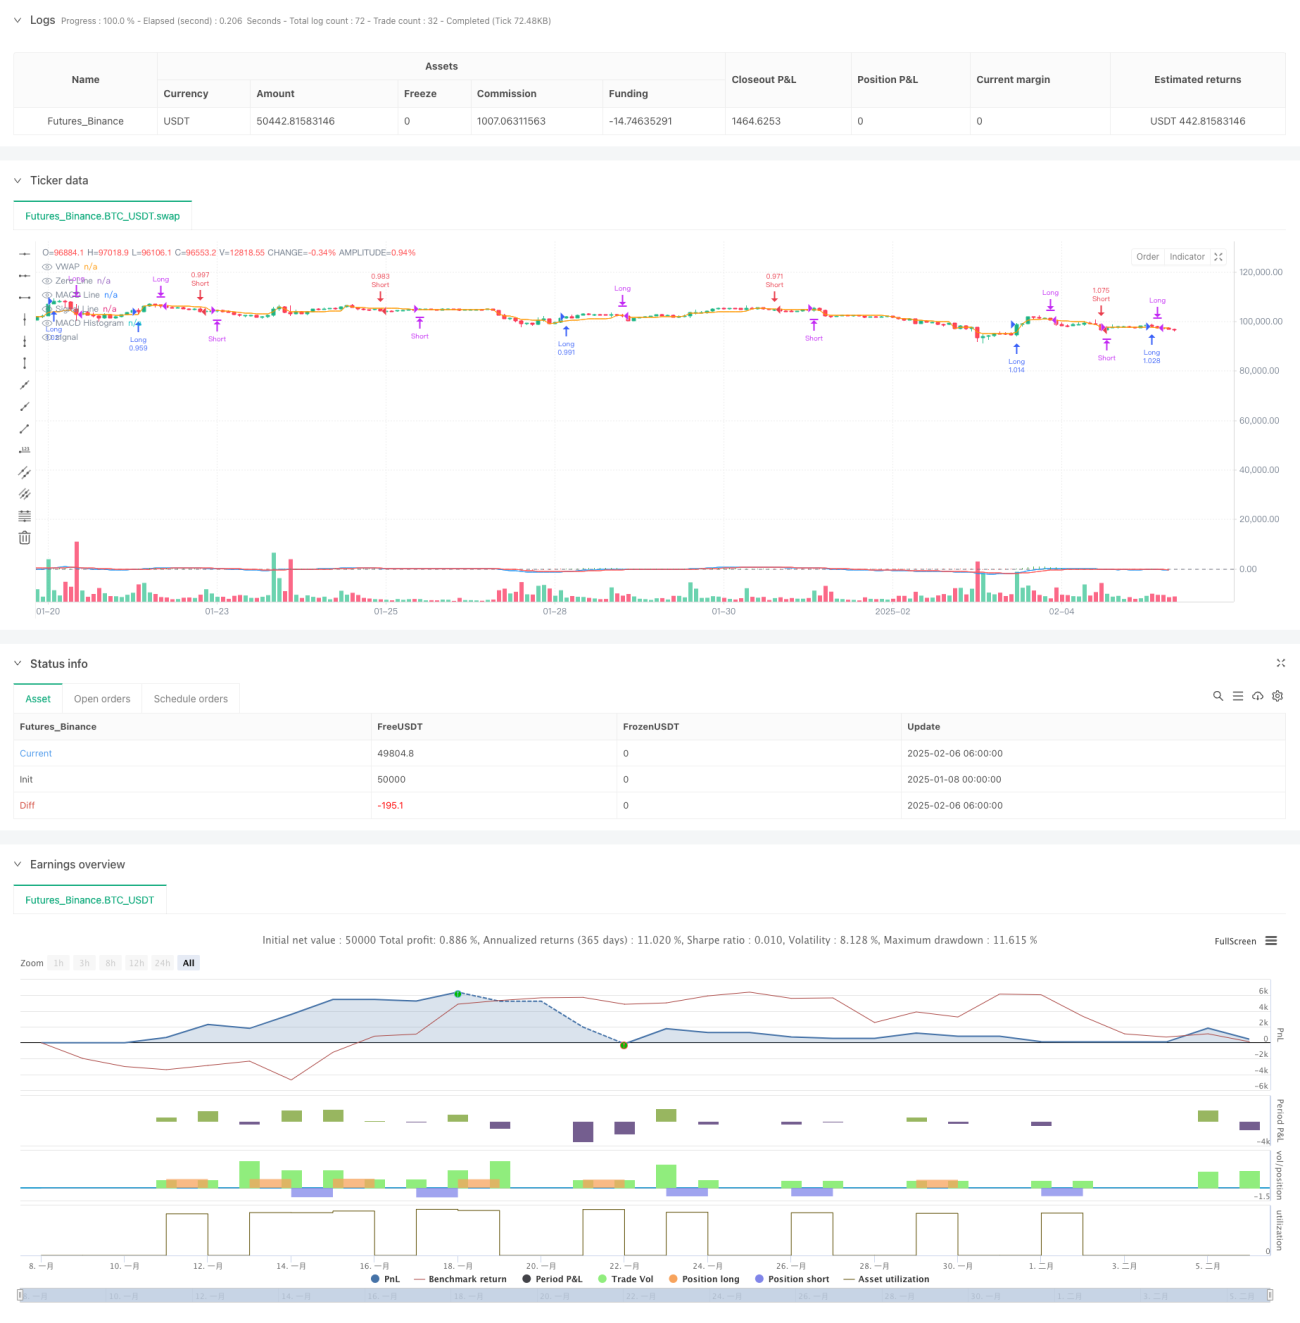
This strategy combines Volume Weighted Average Price (VWAP) and Moving Average Convergence Divergence (MACD) for quantitative trading. It seeks optimal entry and exit points in market trends by combining price momentum indicators with volume weighting. The strategy uses VWAP as a crucial price reference level while utilizing MACD to capture market momentum changes, enabling more precise trading position timing.
Strategy Principles
The core logic is based on the following key elements:
- VWAP calculates the volume-considered average price level to determine if current price is favorably positioned
- MACD consists of fast EMA (12 periods) and slow EMA (26 periods) to capture price momentum
- Long condition: MACD line crosses above signal line and price is above VWAP
- Short condition: MACD line crosses below signal line and price is below VWAP
- Exit logic: Close positions when MACD shows reverse crossover signals or price breaks VWAP
Strategy Advantages
- Multi-dimensional analysis: Combines price, volume, and momentum for trading decisions
- Robust risk control: Reduces false signals through dual confirmation of VWAP and MACD
- High adaptability: Strategy parameters can be adjusted for different market conditions and timeframes
- Clear execution: Entry and exit conditions are well-defined for programmatic implementation
- Good scalability: Simple core logic allows easy addition of auxiliary indicators or filters
Strategy Risks
- Choppy market risk: May generate frequent false breakout signals in sideways markets
- Lag risk: MACD as a lagging indicator may cause slightly delayed entries or exits
- Parameter sensitivity: Strategy performance heavily depends on MACD parameter settings
- Market environment dependency: Strategy performs better in trending markets
- Cost consideration: Frequent trading may incur high transaction costs
Strategy Optimization Directions
- Introduce volatility filters to adjust position sizes in high volatility environments
- Add trend strength indicators to improve strategy adaptation in different market conditions
- Optimize MACD parameters, consider dynamic parameter adjustment based on market characteristics
- Enhance stop-loss mechanisms, suggest adding trailing stops or fixed stops
- Consider adding volume filters to improve signal reliability
Summary
The VWAP-MACD dual indicator strategy provides reliable technical support for trading decisions by combining volume-weighted and momentum analysis. The strategy design is reasonable, logic is clear, and it has good practicality and scalability. Through continuous optimization and risk management improvements, this strategy has the potential to achieve stable returns in actual trading. Traders are advised to conduct thorough backtesting before live implementation and adjust parameters according to specific market characteristics.
/*backtest
start: 2025-01-08 00:00:00
end: 2025-02-06 08:00:00
period: 2h
basePeriod: 2h
exchanges: [{"eid":"Futures_Binance","currency":"BTC_USDT"}]
*/

//@version=5
strategy("VWAP + MACD Strategy", overlay=true, default_qty_type=strategy.percent_of_equity, default_qty_value=200)

// VWAP Calculation- 1